
http://www.genserva.com/acon
SUMMARY OF CLIMATOLOGICAL DATA
SUMMARY OF CLIMATOLOGICAL DATA
|
|
|
Temperature |
Average Temperature |
Average Temperature |
Precipitation |
Precipitation |
|
|
Danville |
Lynchburg |
Danville |
Dulles |
Richmond |
Charlottesville |
|
|
New Bern |
Asheville |
Wilmington |
Asheville |
Cape Hatteras |
Hickory |
|
|
Cape Hatteras |
Anderson Greenville-Spartanburg |
Norh Myrtle Beach |
Greenville-Spartanburg |
Columbia |
North Myrtle Beach |
| STATION | A | B | C | C1 | D | E | F | G | H | I | J | K | K1 | L | M | N | N1 | N2 | O | P | Q | R | R1 | CWA | TIME RECORDED | |
| BCB | 37.4 | 15.4 | 26.4 | -7.8 | 63 | 8 | -5 | 20 | 0 | 9 | 26 | 2 | 62% | 47 | 300 | 14 | 6.5 | 0 | 0 | 0 | 2 | 2 | LWX | 2400 | ||
| CHT | 37.5 | 16.7 | 27.1 | -9.1 | 60.7 | 8 | 2.2 | 24 | 0 | 6 | 26 | 0 | 62% | 21 | 360 | 15 | 1.0 | 360 | 0 | 0 | 1 | 1 | 0 | LWX | 2400 | |
| CHO | 39.8 | 18.6 | 29.2 | -9.0 | 71 | 8 | 0 | 20 | 0 | 7 | 26 | 1 | 45 | 330 | 15 | 6.5 | 0 | 0 | 0 | 1 | 2 | LWX | 2400 | |||
| DAN | 44.9 | 22.3 | 33.6 | -7.3 | 73 | 8 | 3 | 20 | 0 | 4 | 25 | 0 | 56% | 55 | 270 | 14 | 6.7 | 0 | 0 | 0 | 3 | 1 | RNK | 2400 | ||
| DCA | 39.1 | 21.5 | 30.3 | -8.7 | 68 | 8 | 5 | 20 | 0 | 7 | 24 | 0 | 51% | 56 | 330 | 15 | 9.6 | 0 | 0 | 1 | 2 | 1 | LWX | 2400 | ||
| IAD | 35.7 | 15.0 | 25.4 | -10.8 | 60 | 8 | -4 | 24 | 0 | 9 | 28 | 2 | 58% | 56 | 300 | 15 | 8.8 | 0 | 0 | 2 | 3 | 2 | LWX | 2400 | ||
| GAV | 41.51 | 19.98 | 30.74 | -10.0 | 72 | 8 | -1 | 20 | 0 | 6 | 25 | 0 | 54% | 36 | 202 | 14 | 0 | 1 | 2 | 2 | 0 | AKQ | 2400 | |||
| HAM | 39.0 | 23.0 | 31.0 | -11.0 | 67 | 8 | 6 | 20 | 0 | 8 | 26 | 0 | 55 | 270 | 14 | 11.0 | 320 | 0 | 0 | 1 | 1 | 7 | AKQ | 2400 | ||
| HDV | 36.7 | 16.8 | 26.8 | -9.9 | 63 | 8 | -1 | 21 | 0 | 9 | 27 | 1 | 64% | 22 | 202 | 15 | 202 | 0 | 0 | 2 | 3 | 0 | LWX | 2400 | ||
| LYH | 40.1 | 17.6 | 28.8 | -9.4 | 67 | 8 | -11 | 20 | 0 | 8 | 27 | 1 | 58% | 45 | 300 | 14 | 5.8 | 0 | 0 | 2 | 0 | 3 | RNK | 2400 | ||
| NPN | 40.8 | 22.2 | 31.7 | -10.2 | 68.7 | 8 | 6.5 | 20 | 0 | 7 | 25 | 0 | 56 | 290 | 14 | 4.1 | 270 | 0 | 0 | 1 | 3 | 0 | AKQ | 2400 | ||
| FHC | 41.1 | 25.7 | 33.4 | -8.0 | 68 | 8 | 9 | 20 | 0 | 8 | 24 | 0 | 58% | 37 | 320 | 14 | 4.0 | 360 | 0 | 0 | 1 | 4 | 0 | AKQ | 2400 | |
| NOR | 40.9 | 23.4 | 32.1 | -9.3 | 69 | 8 | 8 | 20 | 0 | 9 | 25 | 0 | 53 | 290 | 14 | 0 | 0 | 3 | 4 | 2 | AKQ | 2400 | ||||
| ORF | 41.0 | 23.9 | 32.5 | -10.1 | 70 | 8 | 9 | 20 | 0 | 8 | 24 | 0 | 59% | 52 | 240 | 14 | 11.0 | 0 | 0 | 2 | 1 | 2 | AKQ | 2400 | ||
| POR | 41.9 | 24.6 | 33.3 | -9.2 | 68 | 8 | 7 | 20 | 0 | 8 | 24 | 0 | 67% | 51 | 290 | 14 | 7.2 | 330 | 0 | 0 | 1 | 4 | 0 | AKQ | 2400 | |
| CTR | 42.6 | 19.6 | 31.5 | -8.0 | 70.4 | 8 | -4.8 | 20 | 0 | 6 | 26 | 2 | 58% | 31 | 290 | 14 | 0.5 | 281 | 0 | 0 | 0 | 1 | 0 | AKQ | 2400 | |
| MEC | 41.39 | 23.55 | 32.77 | 71 | 8 | -5 | 20 | 0 | 5 | 21 | 1 | 46% | 0 | 0 | 0 | 2 | 0 | AKQ | 2400 | |||||||
| RIC | 41.9 | 20.9 | 31.4 | -9.5 | 71 | 8 | 4 | 20,21 | 0 | 7 | 25 | 0 | 55% | 56 | 320 | 14 | 8.7 | 0 | 0 | 0 | 3 | 2 | AKQ | 2400 | ||
| ROA | 41.0 | 20.2 | 30.6 | -9.0 | 69 | 8 | 0 | 20 | 0 | 8 | 25 | 1 | 53% | 45 | 300,280 | 2,15 | 8.6 | 0 | 0 | 2 | 1 | 2 | RNK | 2400 | ||
| SVC | 35.6 | 17.9 | 26.8 | -10.8 | 63 | 8 | 0 | 20 | 0 | 10 | 28 | 1 | 1 | 0 | 3 | 3 | 1 | LWX | 2400 | |||||||
| WAL | 36.6 | 18.2 | 27.4 | -11.3 | 60 | 8 | -1 | 20 | 0 | 9 | 27 | 1 | 60 | 330 | 15 | 11.0 | 0 | 0 | 0 | 0 | 3 | AKQ | 2400 | |||
| WSH | 36.6 | 17.4 | 27.0 | -9.6 | 62.7 | 0.9 | 20 | 0 | 9 | 26 | 0 | 63% | 29 | 45 | 12 | 1.2 | 70 | 0 | 0 | 1 | 2 | 0 | LWX | 2400 | ||
| Averages | 39.69 | 20.20 | 29.99 | -9.4 | 67.07 | 1.26 | 0.0 | 7.6 | 25.5 | 0.6 | 58% | 45.4 | 6.6 | 0.0 | 0.0 | 1.1 | 2.1 | 1.4 | ||||||||
| STATION | A | B | C | C1 | D | E | F | G | H | I | J | K | K1 | L | M | N | N1 | N2 | O | P | Q | R | R1 | CWA | TIME RECORDED | |
| STATION | A | B | C | C1 | D | E | F | G | H | I | J | K | K1 | L | M | N | N1 | N2 | O | P | Q | R | R1 | CWA | TIME RECORDED | |
| AVL | 43.5 | 22.3 | 32.9 | -7.4 | 69 | 8 | 3 | 19 | 0 | 5 | 25 | 0 | 61% | 56 | 340 | 15 | 10.1 | 0 | 0 | 2 | 2 | 1 | GSP | 2400 | ||
| MRH | 48.1 | 29.1 | 38.6 | -8.4 | 62 | 2,9 | 12 | 20 | 0 | 2 | 22 | 0 | 49 | 330 | 15 | 12.1 | 0 | 0 | 2 | 0 | 0 | MHX | 2400 | |||
| CLT | 47.6 | 27.1 | 37.4 | -6.5 | 70 | 8 | 7 | 20 | 0 | 2 | 22 | 0 | 52% | 49 | 300 | 14 | 7.3 | 0 | 0 | 2 | 4 | 0 | GSP | 2400 | ||
| ECG | 42.6 | 25.0 | 33.9 | -10.3 | 68 | 8 | 8 | 20 | 0 | 6 | 24 | 6 | 62% | 59 | 310 | 14 | 11.3 | 0 | 0 | 0 | 0 | 1 | AKQ | 2400 | ||
| FAY | 49.2 | 28.1 | 38.7 | -8.6 | 71 | 8 | 10 | 20 | 0 | 2 | 20 | 0 | 60% | 45 | 300,310 | 2,15 | 9.1 | 0 | 0 | 3 | 0 | 4 | RAH | 2400 | ||
| GSO | 44.0 | 23.8 | 33.9 | -8.5 | 72 | 8 | 6 | 20 | 0 | 5 | 23 | 0 | 56% | 49 | 300 | 14 | 8.0 | 0 | 0 | 3 | 2 | 3 | RAH | 2400 | ||
| HSE | 47.8 | 29.1 | 38.4 | -8.4 | 64 | 9 | 12 | 20,21 | 0 | 1 | 19 | 0 | 72% | 50 | 240 | 14 | 10.5 | 0 | 0 | 1 | 0 | 0 | MHX | 2400 | ||
| HKY | 45.4 | 24.4 | 34.9 | -7.7 | 70 | 8 | 5 | 20 | 0 | 4 | 24 | 0 | 46 | 280 | 2 | 5.2 | 0 | 0 | 2 | 2 | 2 | GSP | 2400 | |||
| LBT | 51.2 | 29.9 | 40.5 | -6.3 | 72 | 9 | 13 | 20 | 0 | 1 | 18 | 0 | 64% | 46 | 280 | 2 | 8.0 | 0 | 0 | 3 | 0 | 3 | ILM | 2400 | ||
| EWN | 49.5 | 28.3 | 38.9 | -8.1 | 76 | 9 | 11 | 20 | 0 | 3 | 22 | 0 | 60% | 52 | 300 | 2 | 9.0 | 0 | 0 | 4 | 0 | 0 | MHX | 2400 | ||
| RDU | 45.0 | 24.6 | 34.8 | -9.7 | 72 | 8 | 7 | 20 | 0 | 5 | 24 | 0 | 55% | 48 | 290 | 14 | 6.6 | 1 | 0 | 3 | 3 | 3 | RAH | 2400 | ||
| RAL | 46.2 | 24.0 | 35.1 | -9.4 | 73 | 8 | 7 | 20 | 0 | 5 | 24 | 0 | 29 | 15 | 0 | 0 | 1 | 1 | 1 | RAH | 2400 | |||||
| WHI | 50.7 | 29.0 | 39.9 | -5.9 | 71.0 | 9 | 11.9 | 20 | 0 | 0 | 18 | 0 | 66% | 38 | 340 | 12 | 4.2 | 160 | 0 | 0 | 1 | 1 | 1 | ILM | 2400 | |
| ILM | 52.1 | 29.5 | 40.8 | -8.1 | 72 | 9 | 13 | 20 | 0 | 2 | 22 | 0 | 57% | 51 | 270 | 2 | 9.4 | 0 | 0 | 2 | 2 | 1 | ILM | 2400 | ||
| Averages | 47.35 | 26.73 | 37.05 | -8.1 | 70.1 | 9.0 | 0.0 | 3.1 | 21.9 | 0.4 | 60% | 47.6 | 8.5 | 0.1 | 0.0 | 2.1 | 1.2 | 1.4 | ||||||||
| STATION | A | B | C | C1 | D | E | F | G | H | I | J | K | K1 | L | M | N | N1 | N2 | O | P | Q | R | R1 | CWA | TIME RECORDED | |
| STATION | A | B | C | C1 | D | E | F | G | H | I | J | K | K1 | L | M | N | N1 | N2 | O | P | Q | R | R1 | CWA | TIME RECORDED | |
| AND | 49.4 | 29.2 | 39.3 | -6.2 | 68 | 8 | 9 | 20 | 0 | 1 | 19 | 0 | 45 | 290 | 14 | 6.7 | 0 | 0 | 2 | 1 | 5 | GSP | 2400 | |||
| CAE | 54.1 | 32.1 | 43.1 | -5.4 | 71 | 8 | 12 | 20 | 0 | 0 | 13 | 0 | 61% | 50 | 280 | 2 | 7.0 | 0 | 0 | 1 | 3 | 2 | CAE | 2400 | ||
| CRE | 52.0 | 31.3 | 47.1 | -6.3 | 67 | 9,12 | 15 | 20 | 0 | 0 | 18 | 0 | 66% | 43 | 470 | 2 | 8.4 | 0 | 0 | 2 | 0 | 2 | ILM | 2400 | ||
| CHS | 56.7 | 34.3 | 45.5 | -6.2 | 76 | 22 | 18 | 20 | 0 | 0 | 13 | 0 | 44 | 290 | 2 | 9.1 | 1 | 0 | 1 | 0 | 0 | CHS | 2400 | |||
| CXM | 55.6 | 37.7 | 46.7 | -5.9 | 72 | 22 | 23 | 20 | 0 | 0 | 5 | 0 | 40 | 200 | 17 | 9.0 | CHS | 2400 | ||||||||
| FLO | 52.8 | 30.5 | 41.7 | -6.8 | 72 | 8,9 | 13 | 20 | 0 | 1 | 18 | 0 | 61% | 42 | 270 | 2 | 8.6 | 0 | 0 | 2 | 0 | 2 | ILM | 2400 | ||
| GSP | 48.8 | 28.2 | 38.5 | -7.2 | 68 | 8 | 9 | 20 | 0 | 1 | 21 | 0 | 58% | 46 | 270 | 14 | 6.9 | 0 | 0 | 2 | 5 | 0 | GSP | 2400 | ||
| OGB | 54.8 | 32.7 | 43.7 | -5.9 | 71 | 8,9 | 16 | 20 | 0 | 0 | 14 | 0 | 50 | 270 | 2 | 7.2 | 1 | 0 | 1 | 1 | 1 | CAE | 2400 | |||
| Averages | 53.03 | 32.00 | 43.20 | -6.2 | 70.63 | 9.3 | 0.0 | 0.4 | 15.1 | 0.0 | 62% | 45.0 | 7.9 | 0.3 | 0.0 | 1.6 | 1.4 | 1.7 | ||||||||
| STATION | A | B | C | C1 | D | E | F | G | H | I | J | K | K1 | L | M | N | N1 | N2 | O | P | Q | R | R1 | CWA | TIME RECORDED | |
| STATION | A | B | C | C1 | D | E | F | G | H | I | J | K | K1 | L | M | N | N1 | N2 | O | P | Q | R | R1 | CWA | TIME RECORDED | |
| TRI | 39.9 | 18.8 | 29.4 | -9.6 | 63 | 8 | -13 | 20 | 0 | 8 | 26 | 2 | 53 | 270 | 14 | 5.3 | 0 | 0 | 1 | 2 | 5 | MRX | 2400 | |||
| DAV | 24.6 | 4.1 | 14.4 | 54 | 9 | -15 | 16 | 0 | 22 | 27 | 12 | PBX | 2400 | |||||||||||||
| STATION | T | T1 | U | U1 | V | V1 | W | X | Y | Z | 1 | 2 | 3 | 4 | 5 | 6 | 6A | 7 | 7A | 8 | CWA | TIME RECORDED | ||||
| BCB | 2.12 | -0.69 | 0.68 | 21 | 0.68 | 21 | 1 | 0 | 2.12 | 8.2 | 16 | 17 | 0 | 19.4 | 22.8 | RNK | 2400 | |||||||||
| CHT | 1.63 | -1.11 | 0.84 | 21 | 0.84 | 21 | 9 | 0 | 4.78 | 6.6 | 21 | 8 | 2 | 12.0 | 20.3 | 30.881 | 28 | 29.419 | 2 | 30.125 | LWX | 2400 | ||||
| CHO | 0.96 | -1.74 | 0.40 | 21 | 0.42 | 16-17 | 7 | 0 | 2.66 | 29.420 | 2 | LWX | 2400 | |||||||||||||
| DAN | 2.28 | -0.73 | 0.44 | 2 | 0.66 | 9-10 | 9 | 0 | 3.79 | 6.3 | 26 | 8 | 2 | 9.8 | 9.8 | 30.810 | 28 | 29.440 | 2 | 30.125 | RNK | 2400 | ||||
| DCA | 1.68 | -0.94 | 0.70 | 21 | 0.80 | 21-22 | 9 | 0 | 5.41 | 2.9 | 16 | 11 | 4 | 9.6 | 13.2 | 29.420 | 2 | LWX | 2400 | |||||||
| IAD | 1.76 | -0.98 | 0.93 | 21 | 0.93 | 21 | 8 | 0 | 5.02 | 8.9 | 21 | 11 | 4 | 16.1 | 26.4 | 29.420 | 2 | LWX | 2400 | |||||||
| GAV | 3.55 | 1.04 | 0.85 | 21 | 1.18 | 21-22 | 10 | 0 | 6.65 | 5.3 | 16 | 9 | 2 | 11.2 | 13.2 | 30.870 | 28 | 29.340 | 9 | 30.110 | AKQ | 2400 | ||||
| HAM | 1.90 | -1.70 | 0.43 | 26 | 0.75 | 16-17 | 12 | 0 | 4.92 | 9.0 | 26 | 13 | 5 | 18.0 | 19.0 | 30.870 | 28 | 29.360 | 2 | 30.100 | AKQ | 2400 | ||||
| HDV | 1.85 | -0.89 | 0.94 | 21 | 8 | 0 | 5.40 | 5.2 | 21 | 11 | 5 | 11.3 | 20.6 | 30.860 | 28 | 29.390 | 2 | 30.125 | AKQ | 2400 | ||||||
| LYH | 2.52 | -0.41 | 0.78 | 16 | 1.02 | 16-17 | 10 | 0 | 4.38 | 7.2 | 16 | 10 | 4 | 20.3 | 20.4 | 30.840 | 28 | 29.460 | 2 | 30.150 | RNK | 2400 | ||||
| NPN | 3.30 | 0.01 | 1.14 | 26 | 1.14 | 26 | 12 | 1 | 7.09 | 8.3 | 26 | 9 | 4 | 16.0 | 16.5 | 30.840 | 28 | 29.350 | 2 | 30.095 | AKQ | 2400 | ||||
| FHC | 3.32 | -0.08 | 0.88 | 28 | 1.02 | 16-17 | 14 | 0 | 7.19 | 5.5 | 26 | 9 | 4 | 11.5 | 12.5 | 30.840 | 28 | 29.360 | 2 | 30.092 | AKQ | 2400 | ||||
| NOR | 3.04 | -0.36 | 0.91 | 26 | 1.07 | 16-7 | 13 | 0 | 7.05 | 5.5 | 26 | 8 | 3 | 11.6 | 12.6 | AKQ | 2400 | |||||||||
| ORF | 2.54 | -0.58 | 0.61 | 17 | 0.61 | 17 | 12 | 0 | 6.18 | 5.5 | 26 | 9 | 4 | 11.5 | 12.5 | 30.830 | 28 | 29.360 | 2 | 30.095 | AKQ | 2400 | ||||
| POR | 2.74 | -0.42 | 0.60 | 26 | 1.02 | 16-17 | 15 | 0 | 6.95 | 6.0 | 26 | 9 | 4 | 13.0 | 13.5 | 30.810 | 28 | 29.410 | 2 | 30.091 | AKQ | 2400 | ||||
| CTR | 3.49 | 1.56 | 0.69 | 22 | 1.06 | 21-22 | 10 | 0 | 6.69 | 6.0 | 26 | 5 | 3 | 11.5 | 11.5 | 30.820 | 28 | 29.670 | 18 | 30.055 | AKQ | 2400 | ||||
| MEC | 3.50 | 1.37 | 22 | 1.37 | 22 | 6 | 1 | 7.34 | 6.0 | 17 | 2 | 2 | 11.5 | 11.6 | AKQ | 2400 | ||||||||||
| RIC | 3.77 | 1.01 | 0.77 | 22 | 1.53 | 21-22 | 9 | 0 | 7.26 | 6.2 | 16 | 8 | 3 | 12.2 | 12.5 | 30.870 | 28 | 29.410 | 2 | 30.140 | AKQ | 2400 | ||||
| ROA | 2.61 | -0.28 | 1.04 | 21 | 1.07 | 21-22 | 12 | 1 | 3.92 | 7.5 | 16 | 11 | 4 | 19.1 | 19.6 | 30.820 | 28 | 29.480 | 2 | 30.150 | RNK | 2400 | ||||
| SVC | 1.60 | -1.41 | 0.50 | 21 | 0.60 | 21-22 | 12 | 0 | 5.94 | 4.5 | 21 | 8 | 4 | 12.4 | 19.0 | 29.210 | 2 | LWX | 2400 | |||||||
| WAL | 3.06 | 0.30 | 0.73 | 22 | 1.11 | 21-22 | 14 | 0 | 7.79 | 3.5 | 16 | 10 | 4 | 11.0 | 11.0 | 30.840 | 28 | 29.360 | 2 | 30.100 | AKQ | 2400 | ||||
| WSH | 1.41 | -1.17 | 0.76 | 21 | 0.76 | 21 | 8 | 0 | 4.18 | 6.6 | 21 | 9 | 3 | 11.7 | 19.2 | 30.910 | 28 | 29.480 | 2 | 30.195 | LWX | 2400 | ||||
| Averages | 2.48 | -0.46 | 0.77 | 0.94 | 10.0 | 0.1 | 5.58 | 6.2 | 9.3 | 3.3 | 13.4 | 16.1 | 30.847 | 29.408 | 30.117 | |||||||||||
| STATION | T | T1 | U | U1 | V | V1 | W | X | Y | Z | 1 | 2 | 3 | 4 | 5 | 6 | 6A | 7 | 7A | 8 | CWA | TIME RECORDED | ||||
| STATION | T | T1 | U | U1 | V | V1 | W | X | Y | Z | 1 | 2 | 3 | 4 | 5 | 6 | 6A | 7 | 7A | 8 | CWA | TIME RECORDED | ||||
| AVL | 2.78 | -0.98 | 0.86 | 16 | 0.89 | 16-17 | 11 | 0 | 5.84 | 4.3 | 25 | 13 | 4 | 10.1 | 13.3 | 30.680 | 28 | 29.550 | 2 | 30.115 | GSP | 2400 | ||||
| MRH | 5.28 | 2.08 | 0.86 | 17 | 1.10 | 16-17 | 13 | 0 | 9.55 | T | 19 | 1 | 0 | T | T | 29.420 | 26 | MHX | 2400 | |||||||
| CLT | 3.02 | -0.30 | 0.87 | 9 | 1.00 | 9-10 | 11 | 0 | 5.82 | 1.7 | 25 | 7 | 1 | 3.1 | 3.1 | 30.740 | 28 | 29.550 | 2 | 30.145 | GSP | 2400 | ||||
| ECG | 2.79 | -0.39 | 0.72 | 26 | 0.85 | 16-17 | 10 | 0 | 6.80 | T | 11 | 1 | 0 | T | T | 30.810 | 28 | 29.420 | 2 | 30.115 | AKQ | 2400 | ||||
| FAY | 3.28 | 0.52 | 0.59 | 26 | 1.15 | 25-26 | 11 | 0 | 7.65 | 29.470 | 2 | RAH | 2400 | |||||||||||||
| GSO | 2.64 | -0.32 | 0.45 | 22 | 0.66 | 25-26 | 10 | 0 | 4.68 | 3.4 | 26 | 8 | 4 | 9.6 | 9.6 | 29.470 | 2 | RAH | 2400 | |||||||
| HSE | 7.34 | 3.32 | 1.56 | 5 | 1.64 | 4-5 | 13 | 1 | 11.95 | 2.0 | 24 | 2 | 1 | 2.0 | 2.0 | 29.420 | 26 | MHX | 2400 | |||||||
| HKY | 1.73 | -1.99 | 0.44 | 16 | 0.48 | 16-17 | 10 | 0 | 4.45 | 30.710 | 28 | 29.470 | 2 | 30.090 | GSP | 2400 | ||||||||||
| LBT | 4.77 | 1.87 | 0.82 | 25 | 1.55 | 25-26 | 11 | 0 | 9.46 | 30.720 | 28 | 29.560 | 26 | 30.140 | ILM | 2400 | ||||||||||
| EWN | 3.88 | 0.22 | 1.43 | 26 | 1.43 | 26 | 9 | 1 | 8.37 | 3.0 | 24 | 2 | 0 | 3.0 | 3.0 | 29.420 | 26 | MHX | 2400 | |||||||
| RDU | 2.91 | -0.32 | 0.72 | 26 | 1.08 | 25-26 | 11 | 0 | 6.26 | 3.2 | 26 | 7 | 3 | 7.9 | 7.9 | 29.470 | 24 | RAH | 2400 | |||||||
| RAL | 2.10 | -1.13 | 0.50 | 9-10 | 10 | 0 | 5.52 | 6.5 | 26 | 6 | 2 | 8.9 | 8.9 | 30.860 | 28 | 29.650 | 14 | 30.255 | RAH | 2400 | ||||||
| WHI | 4.01 | 0.60 | 1.11 | 25 | 1.69 | 25-26 | 12 | 1 | 6.49 | 0.5 | 24 | 1 | 0 | 0.5 | 0.5 | 30.708 | 28 | 29.518 | 26 | 30.095 | ILM | 2400 | ||||
| ILM | 4.34 | 0.72 | 0.92 | 26 | 1.39 | 25-26 | 12 | 0 | 9.32 | 0.3 | 24 | 0 | 3 | 0.3 | 0.3 | 30.710 | 28 | 29.480 | 26 | 30.095 | ILM | 2400 | ||||
| Averages | 3.63 | 0.28 | 0.87 | 1.10 | 11.0 | 0.2 | 7.30 | 2.5 | 4.8 | 1.8 | 4.5 | 4.9 | 30.742 | 29.491 | 30.131 | |||||||||||
| STATION | T | T1 | U | U1 | V | V1 | W | X | Y | Z | 1 | 2 | 3 | 4 | 5 | 6 | 6A | 7 | 7A | 8 | CWA | TIME RECORDED | ||||
| STATION | T | T1 | U | U1 | V | V1 | W | X | Y | Z | 1 | 2 | 3 | 4 | 5 | 6 | 6A | 7 | 7A | 8 | CWA | TIME RECORDED | ||||
| AND | 3.29 | -0.61 | 0.65 | 16 | 0.85 | 1-2 | 11 | 0 | 6.14 | 30.690 | 28 | 29.610 | 2 | 30.150 | GSP | 2400 | ||||||||||
| CAE | 4.76 | 1.15 | 1.45 | 25 | 1.65 | 25-26 | 11 | 1 | 7.36 | T | 21,24 | 2 | 0 | T | T | 30.680 | 28 | 29.610 | 26 | 30.145 | CAE | 2400 | ||||
| CRE | 3.07 | -0.35 | 0.81 | 25 | 1.38 | 25-26 | 11 | 0 | 7.19 | 30.680 | 28 | 29.480 | 26 | 30.080 | ILM | 2400 | ||||||||||
| CHS | 4.40 | 1.44 | 1.64 | 25 | 2.48 | 25-26 | 9 | 1 | 7.93 | 0.0 | T | 30.630 | 28 | 29.480 | 24 | 30.055 | CHS | 2400 | ||||||||
| CXM | 4.01 | 1.50 | 1.28 | 25 | 1.28 | 25 | 10 | 1 | 7.22 | CHS | 2400 | |||||||||||||||
| FLO | 4.50 | 1.58 | 1.02 | 25 | 1.54 | 25-26 | 12 | 1 | 6.93 | 30.690 | 28 | 29.560 | 26 | 30.125 | ILM | 2400 | ||||||||||
| GSP | 3.46 | -0.51 | 0.87 | 16 | 1.02 | 16-17 | 11 | 0 | 7.32 | 1.6 | 25 | 7 | 3 | 3.7 | 3.7 | 30.690 | 28 | 29.550 | 2 | 30.120 | GSP | 2400 | ||||
| OGB | 4.03 | 0.44 | 1.53 | 25 | 1.76 | 25-26 | 13 | 1 | 6.85 | 30.660 | 28 | 29.560 | 26 | 30.110 | CAE | 2400 | ||||||||||
| Averages | 3.94 | 0.58 | 1.16 | 1.50 | 11.0 | 0.63 | 7.12 | 0.80 | 4.5 | 1.5 | 1.9 | 1.2 | 30.674 | 29.550 | 24 | 30.112 | ||||||||||
| STATION | T | T1 | U | U1 | V | V1 | W | X | Y | Z | 1 | 2 | 3 | 4 | 5 | 6 | 6A | 7 | 7A | 8 | CWA | TIME RECORDED | ||||
| STATION | T | T1 | U | U1 | V | V1 | W | X | Y | Z | 1 | 2 | 3 | 4 | 5 | 6 | 6A | 7 | 7A | 8 | CWA | TIME RECORDED | ||||
| TRI | 3.05 | -0.40 | 0.79 | 21 | 0.79 | 21 | 13 | 0 | 5.33 | 3.7 | 24 | 13 | 5 | 14.0 | 15.5 | 30.640 | 28 | 29.530 | 2 | 30.085 | MRX | 2400 | ||||
| DAV | 3.98 | 0.97 | 22 | 19 | 0 | 8.59 | 9.1 | 22 | 25 | 13 | 45.6 | 123.2 | PBX | 2400 | ||||||||||||
| STATION | T | T1 | U | U1 | V | V1 | W | X | Y | Z | 1 | 2 | 3 | 4 | 5 | 6 | 6A | 7 | 7A | 8 | CWA | TIME RECORDED | ||||
Virginia:
Arlington/Washington, D.C. - "BOTH THE MONTHLY AVERAGE TEMPERATURE AND MONTHLY PRECIPITATION WERE WELL BELOW NORMAL. MONTHLY SNOWFALL WAS ABOVE NORMAL. THIS WAS THE FIRST TIME BACK-TO- BACK FEBRUARIES HAD ABOVE NORMAL SNOWFALL SINCE 2006-2007. THIS WAS THE 16TH COLDEST FEBRUARY ON RECORD AND THE COLDEST FEBRUARY SINCE 2007. IT WAS ALSO THE COLDEST MONTH OF ANY CALENDAR MONTH IN WASHINGTON DC SINCE JANUARY 1994...WHICH HAD AN AVERAGE MONTHLY TEMPERATURE OF 28.8. ALTHOUGH THE MONTH OVERALL WAS QUITE COLD...THERE WAS ONE WARM DAY ON THE 8TH THAT TIED A RECORD DAILY HIGH TEMPERATURE OF 68 DEGREES SET ON THAT DATE IN 1900. A RECORD DAILY LOW TEMPERATURE OF 5 DEGREES WAS SET ON THE 20TH... BREAKING THE OLD RECORD OF 8 DEGREES SET IN 1896. THIS WAS THE FIRST RECORD COLD TEMPERATURE SET IN WASHINGTON DC SINCE A RECORD LOW MAXIMUM TEMPERATURE RECORD WAS BROKEN ON JANUARY 22ND 2014. IT WAS ALSO THE COLDEST AIR TEMPERATURE OBSERVED IN WASHINGTON DC SINCE FEBRUARY 5TH 1996. " - [ - - ] - from NWS Sterling, VAChantilly - " February average temperatures were far below normal and precipitation was below normal. The mean monthly temperature was 27.1° (-9.1°). The mean high temperature was 37.5° (-8.9°) and the mean low temperature was 16.7° (-9.3°). Record low maximum temperature records were set on the 14th (19.7°), 15th (19.7°), 16th (18.0°), 19th (21.5°) and 20th (25.8°). Record low temperatures were set on the 16th (7.6°) and 24th (2.2°) and tied on the 21st (7.1°). February precipitation of 1.63” was below average (-1.11”). Snow was observed on the 12th (T), 14th (0.4”), 16th (2.6”), 17th (0.5”), 18th (T), 19th (T), 21st (6.6”) and 26th (1.9”). Freezing rain and sleet was observed on the 21st (0.15”). The 6.6” of snow that fell on the 21st set a new daily record. *Please note, anemometer is currently partially obstructed from the North and East " - [ - - ] - Member Russ Topping
Dulles - from NWS Sterling (KLWX): " THE MONTHLY AVERAGE TEMPERATURE WAS WELL BELOW NORMAL AS WAS THE MONTHLY PRECIPITATION. THIS WAS THE SECOND COLDEST FEBRUARY ON RECORD. ONLY FEBRUARY 1979 WAS COLDER...AVERAGING 23.3 DEGREES. IT WAS ALSO THE COLDEST MONTH OF ANY CALENDAR MONTH AT DULLES SINCE DECEMBER 1989...WHICH HAD AN AVERAGE MONTHLY TEMPERATURE OF 23.1 DEG. TEN COLD TEMPERATURE RECORDS WERE SET AT DULLES. A RECORD DAILY LOW TEMPERATURE OF 6 DEGREES WAS SET ON THE 15TH...BREAKING THE OLD RECORD OF 7 DEGREES SET IN 1965. ALSO...A RECORD DAILY LOW MAXIMUM TEMPERATURE RECORD OF 18 DEGREES BROKE THE OLD RECORD OF 22 DEGREES SET IN 1979 ON THIS DAY. A SECOND RECORD DAILY LOW TEMPERATURE OF 6 DEGREES WAS SET ON THE 16TH...BREAKING THE OLD RECORD OF 11 DEGREES SET IN 1987. ALSO...A RECORD DAILY LOW MAXIMUM TEMPERATURE OF 16 DEGREES BROKE THE OLD RECORD OF 22 DEGREES SET IN 2003 ON THIS DAY. A THIRD RECORD DAILY LOW TEMPERATURE OF 6 DEGREES WAS SET ON THE 19TH...BREAKING THE OLD RECORD OF 7 SET IN 1979. ALSO...A RECORD DAILY MAXIMUM TEMPERATURE RECORD OF 15 DEGREES BROKE THE OLD RECORD OF 28 DEGREES SET IN 1993. A FOURTH RECORD DAILY LOW MAXIMUM TEMPERATURE OF 19 DEGREES WAS SET ON THE 20TH...BREAKING THE OLD RECORD OF 26 SET IN 1972. A FOURTH RECORD DAILY LOW TEMPERATURE OF -4 DEGREES WAS SET ON THE 24TH...BREAKING THE OLD RECORD OF 14 DEGREES SET IN 1967. THIS WAS ALSO THE COLDEST AIR TEMPERATURE AT DULLES SINCE FEBRUARY 6TH 1996. A RECORD DAILY LOW MAXIMUM TEMPERATURE OF 27 DEGREES WAS ALSO SET ON THE 24TH...BREAKING THE OLD RECORD OF 28 DEGREES SET IN 1967. A FINAL RECORD DAILY LOW TEMPERATURE WAS SET ON THE 25TH WHEN THE TEMPERATURE DROPPED TO 6 DEGREES. THIS BROKE THE OLD RECORD OF 9 DEGREES WHICH WAS SET IN 1967. MONTHLY SNOWFALL WAS WELL ABOVE NORMAL. THERE WAS NEARLY AS MUCH SNOW THIS MONTH AS THERE WAS IN FEBRUARY OF 2014. THIS ALSO MARKS THE FIRST TIME BACK-TO-BACK FEBRUARIES HAD ABOVE NORMAL SNOWFALL SINCE 2006-2007. A RECORD DAILY MAXIMUM SNOWFALL OF 8.9 INCHES WAS SET ON THE 21ST...BREAKING THE OLD RECORD OF 2.7 INCHES SET IN 1993. A RECORD DAILY MAXIMUM RAINFALL (LIQUID EQUIVALENT) OF 0.93 INCHES WAS ALSO SET ON THIS DAY...BREAKING THE OLD RECORD OF 0.85 FROM 1993. " - [ - - ]
Herndon - from member Randy Ashby: " February was well below normal for temperature and below normal for precipitation. The temperatures ranged between a high of 63 and a low of -1 and was 9.9 degrees below normal. Both the average high and low temperatures for the month were the lowest ever recorded at this site (21 years of record keeping). On the precipitation side, the month was 0.89” below normal, with 1.85” measured. We had 11.3” of snow; with some snow falling on 11 days (including five days when sleet also fell). We also had some freezing rain on two days. The snowfall was 3” above normal and we have now had 20.6” of snow for the year. " - [ - - ]
Hampton - from David Kessel - " Coldest February since 1978 Record Low Maximums: 02/13 28, 02/16 23, 02/19 26, 02/20 19. 02/20/15 is coldest for February 20- note Langley Air Force Base records go back to 1918- coldest ever for the date- previous record was 1934. Record Low Minimums: 02/19 11, 02/20 6* latest single digit date, 02/21 10. LATEST FOR A SINGLE DIGIT LOW TEMPERATURE FEBRUARY 20, Record Daily Snowfall 9.0 inches February 26, Monthly Snowfall 18.0 inches tied for second with 1980, Monthly Mean Max of 39 2nd lowest only to 1978, Monthly Mean of 31 ties 1978, Monthly Mean Low of 23 is a record. " - [ - - ]
Norfolk - from NWS Wakefield (AKQ): "View the NWS AKQ Wakefield February 2015 Climate Summary with a click here " - [ - + ]
Portsmouth - from Bill Trotter: " The month's average temperature of 33.3° was 9.2° BELOW NORMAL. Precipitation (2.74") was BELOW NORMAL by 0.42" or 87% of the February average during the period from 1977 to 2014. Rainfall for the year through February 28th was 6.95" (+0.14" or 102% of normal). To view the station monthly and year-to-date climatological summary (LCD) for this Portsmouth station, please click here. The average temperature for February 2015 of 33.3° is the 2nd COLDEST February in the database to 1977. The top 5 coldest Februarys include: 1) 32.3° in 1978 2) 33.3° in 2015 3) 34.2° in 1979 4) 34.9° in 1980 5) 37.1° in 2010. The monthly snowfall for February 2015 is 13.0" in West Cradock, Portsmouth. This makes February 2015 the 3rd Snowiest February in the database to 1977. The top 5 snowiest Februarys include: 1) 21.0" in 1989 2) 19.2" in 1980 3) 13.0" in 2015 4) 10.5" in 1979 5) 8.0" in 1996 Frontal passages were recorded on the 2nd, 5th, 9th, 10th, 12th, 17th, 19th, 23rd, and 26th. FROST was recorded on 1st, 4th, and 27th. STATION RECORDS: 14th - WIND GUST 51mph [previous 50 2008], 15th - TEMPERATURE Minimum 17° [22° 1981], 15th - TEMP Min Hi 29° [37° 2007], 16th - TEMP Min 16° [20° 1991], 16th - TEMP Min Hi 23° [30° 1987], 19th - TEMP Min 14° [17° 1979], 20th - TEMP Min 7° [19° 1979], 20th - TEMP Min Hi 21° [38° 1978], 21st - TEMP Min 11° [23° 2013], 24th - TEMP Min Hi 29° [34° 1989], 25th - TEMP Min 21° [22° 1989], 26th - SNOW 6.0" [1.5" 1993], 27th - TEMP Min 22° TIED [1990], 28th - TEMP Min Hi 31° [35° 2014]. " - [ - - ]
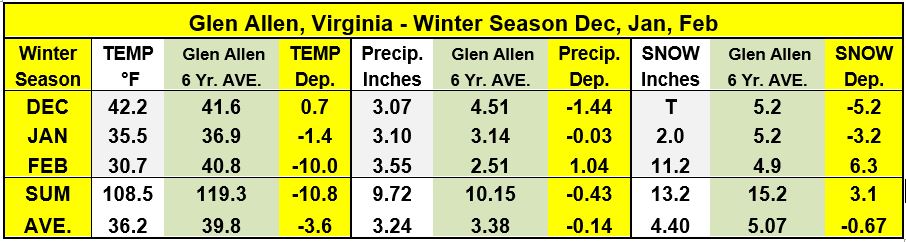
Glen
Allen - from Lowell Koontz: "
February was the coldest February on record with the monthly mean temperature of 30.7°F, a negative 10°F departure making it the coldest month ever at the Glen Allen station and even 1.9°F colder than the coldest January mean. There were 6 days that the maximum temperature was 32°F or less; the previous record was only 1 day for February. February had 15 days that the minimum temperature was 20°F or lower; the previous record was only 6 days for February. The -1.2°F minimum on the 20th was the all-time station record lowest temperature. On February 20th the dew point fell to -14.6°F which was also an all-time station record for Glen Allen. The highest temperature this month was an impressive72°F recorded on February 8th for such a cold month. The maximum temperature of only 21.1°F on the 16th was another all-time station record. The 20th was also the coldest day at this station for any month with a daily mean of 10.9°F; the previous record was 14.5°F on January 7, 2014. The average maximum, minimum and mean were all-time station records. The average mean for February was even -2.7°F lower than the lowest January mean. Glen Allen set 51 new six year daily records for the month of February
The precipitation for February was 3.55 inches which was a departure of +1.04 inches. Only two other Februarys have had more precipitation.
The snowfall for February was 11.2 inches which was 6.3 inches above the average and the most snow in February since 2010 with 16.1 inches.
The maximum wind for the month was 36 mph on the 14th ahead of a strong arctic cold front.
A new record barometric pressure of 30.87 inches on February 28th set a new all-time high pressure record for the Glen Allen station. The average pressure for February was a new record high and it was the windiest February on record with also the lowest average relative humidity. Many of these records can be contributed to the many February Arctic fronts affecting Glen Allen.
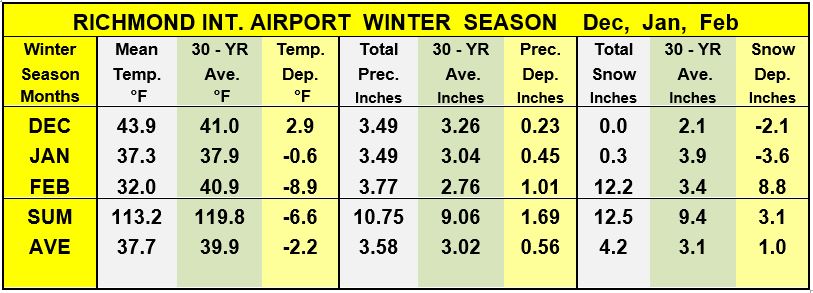
Richmond - from contributor Lowell Koontz (GAV): "
The Airport set nine new daily records for February. Four were record low daily means (coldest days) for the date on the 16th, 19th, 20th and 21st. Three records were set for record low maximums on the 16th, 19th and 21st. The other two were for record low minimums for the date on February 19th and 21st.
The Airport had a 67° temperature range for the month from the maximum of 71° on the eighth to a minimum of 4°F on the 20th and 21st. The following records were established for the 118 year period. The average maximum was 41.6°F; only five years have had a lower average maximum temperature and the record was 37.6°F set in 1934. The lowest maximum for the month was 21°F on the 20th; only five years have recorded lower maximum temperatures in February. The average minimum temperature was 20.9°F and only three years in the past 118 years had a lower minimum average. The highest minimum temperature for the month was 36°; only four years were lower and the current record was 31°F in 1978. The lowest minimum temperature recorded was 4°F and only 10 Februarys have had a lower minimum temperature. The mean for the month was 32.0°F making it the fifth coldest February in history. It was also the coldest February since 1979 when the mean temperature was 28.6°F. The coldest February was in 1934 with a mean average of 28 .2°F. The lowest daily mean was 12.5° on the 20th and only six years have had a colder February day.
The Airport recorded 3.77 inches of precipitation for the month a departure of 1.01 inches making it the 38th wettest February in the past 118 years.
Measurable snowfall at the Richmond International Airport this past February was 12.2 inches making it the ninth snowiest February in Richmond records and the most snow in February since 1989. The 6.2 inches of snow that fell on the 16th was the 13th largest daily snow recorded in Richmond for February.
" - [ - + ]
Richmond - from NWS Wakefield (AKQ): " View the NWS AKQ Wakefield February 2015 Climate Summary for Richmond with a click here " - [ - + ]
North Carolina:
Fayetteville - from NWS Raleigh (RAH): " FEBRUARY 16...A RECORD LOW MAXIMUM TEMPERATURE OF 33 DEGREES WAS TIED AT THE FAYETTEVILLE REGIONAL AIRPORT. THIS TIED THE RECORD OF 33 DEGREES LAST SET IN 1943. FEBRUARY 17...A RECORD LOW MAXIMUM TEMPERATURE OF 33 DEGREES WAS TIED AT THE FAYETTEVILLE REGIONAL AIRPORT. THIS TIED THE RECORD OF 33 DEGREES LAST SET IN 2003. FEBRUARY 20...A RECORD LOW TEMPERATURE OF 10 DEGREES WAS SET AT THE FAYETTEVILLE REGIONAL AIRPORT. THIS BROKE THE PREVIOUS RECORD OF 12 DEGREES SET IN 1958. FEBRUARY 20...A RECORD LOW MAXIMUM TEMPERATURE OF 31 DEGREES WAS SET AT THE FAYETTEVILLE REGIONAL AIRPORT. THIS BROKE THE PREVIOUS RECORD OF 37 DEGREES SET IN 1972. FEBRUARY 24...A RECORD LOW MAXIMUM TEMPERATURE OF 34 DEGREES WAS SET AT THE FAYETTEVILLE REGIONAL AIRPORT. THIS BROKE THE PREVIOUS RECORD OF 35 DEGREES SET IN 1948. THE MONTHLY AVERAGE TEMPERATURE OF 38.7 DEGREES IS THE 7TH COLDEST FEBRUARY ON RECORD. " - [ - + ]
Greensboro - from NWS Raleigh (RAH): " FEBRUARY 15...A RECORD LOW MAXIMUM TEMPERATURE OF 28 DEGREES WAS TIED AT THE PIEDMONT-TRIAD INTERNATIONAL AIRPORT. THIS TIED THE RECORD OF 28 DEGREES LAST SET IN 1943. FEBRUARY 16...A RECORD LOW MAXIMUM TEMPERATURE OF 24 DEGREES WAS SET AT THE PIEDMONT-TRIAD INTERNATIONAL AIRPORT. THIS BROKE THE PREVIOUS RECORD OF 27 DEGREES SET IN 1958. FEBRUARY 19...A RECORD LOW TEMPERATURE OF 9 DEGREES WAS SET AT THE PIEDMONT-TRIAD INTERNATIONAL AIRPORT. THIS BROKE THE PREVIOUS RECORD OF 12 DEGREES SET IN 1979. FEBRUARY 19...A RECORD LOW MAXIMUM TEMPERATURE OF 20 DEGREES WAS SET AT THE PIEDMONT-TRIAD INTERNATIONAL AIRPORT. THIS BROKE THE PREVIOUS RECORD OF 32 DEGREES SET IN 1958. FEBRUARY 20...A RECORD LOW TEMPERATURE OF 6 DEGREES WAS SET AT THE PIEDMONT-TRIAD INTERNATIONAL AIRPORT. THIS BROKE THE PREVIOUS RECORD OF 14 DEGREES SET IN 1934. FEBRUARY 20...A RECORD LOW MAXIMUM TEMPERATURE OF 27 DEGREES WAS SET AT THE PIEDMONT-TRIAD INTERNATIONAL AIRPORT. THIS BROKE THE PREVIOUS RECORD OF 29 DEGREES SET IN 1947. FEBRUARY 25...A RECORD SNOWFALL OF THREE INCHES WAS SET AT THE PIEDMONT-TRIAD INTERNATIONAL AIRPORT. THIS BROKE THE PREVIOUS RECORD OF 0.6 INCH SET IN 1964. THE MONTHLY AVERAGE TEMPERATURE OF 33.9 DEGREES TIES FEBRUARY 1963 FOR THE 6TH COLDEST FEBRUARY ON RECORD. - [ - -]
Raleigh - from NWS RALEIGH (RAH): " FEBRUARY 15...A RECORD LOW MAXIMUM TEMPERATURE OF 29 DEGREES WAS TIED AT THE RALEIGH-DURHAM INTERNATIONAL AIRPORT. THIS TIED THE RECORD OF 29 DEGREES LAST SET IN 1943. FEBRUARY 16...A RECORD LOW MAXIMUM TEMPERATURE OF 27 DEGREES WAS SET AT THE RALEIGH-DURHAM INTERNATIONAL AIRPORT. THIS BROKE THE PREVIOUS RECORD OF 30 DEGREES SET IN 1943. FEBRUARY 19...A RECORD LOW MAXIMUM TEMPERATURE OF 23 DEGREES WAS SET AT THE RALEIGH-DURHAM INTERNATIONAL AIRPORT. THIS BROKE THE PREVIOUS RECORD OF 31 DEGREES SET IN 1903. FEBRUARY 20...A RECORD LOW TEMPERATURE OF 7 DEGREES WAS SET AT THE RALEIGH-DURHAM INTERNATIONAL AIRPORT. THIS BROKE THE PREVIOUS RECORD OF 13 DEGREES SET IN 1979. FEBRUARY 20...A RECORD LOW MAXIMUM TEMPERATURE OF 26 DEGREES WAS SET AT THE RALEIGH-DURHAM INTERNATIONAL AIRPORT. THIS BROKE THE PREVIOUS RECORD OF 32 DEGREES SET IN 1947. THE MONTHLY AVERAGE TEMPERATURE OF 34.8 DEGREES TIES FEBRUARY 1934 FOR THE 4TH COLDEST FEBRUARY ON RECORD. " - [ - - ]
Raleigh - from contributor Bob Woodson (RAL): " VERY COLD FEBRUARY WITH THE AVERAGE DAILY TEMPERATURE 9.4 DEGREES BELOW NORMAL. THERE WERE ALSO 5 DAYS THAT REMAINED AT OR BELOW FREEZING; HIGHLY UNUSUAL FOR FEBRUARY. WINTER PRECIPITATION OCCURRED SEVERAL TIMES DURING THE MONTH INCLUDING 6.5 INCHES OF SNOW ON THE 25- 26. WIDESPREAD POWER OUTAGES OCCURRED ON THE 26TH FROM THE HEAVY WEIGHT OF THE SNOW BRINGING DOWN MANY BRANCHES AND TREES. " - [ - - ]
Wilmington - from NWS Wilmington, NC (ILM): " FIFTH COLDEST FEBRUARY ON RECORD... LAST TIME IT WAS THIS COLD: 1978. " - [ - + ]
South Carolina:
North Charleston - from NWS Charleston (CHS): " RECORDS ESTABLISHED DURING THE MONTH: *FEB 19 - RECORD LOW MAXIMUM TEMPERATURE OF 36 DEGREES, *FEB 20 - RECORD LOW TEMPERATURE OF 18 DEGREES, *FEB 20 - RECORD LOW MAXIMUM TEMPERATURE OF 39 DEGREES. " - [ - + ]
Florence - from NWS Charleston (CHS): " SEVENTH COLDEST FEBRUARY ON RECORD. LAST YEAR IT WAS THIS COLD: 2010. " - [ - + ]
COLUMN DENOTATIONS:
| A maximum mean temperature | T total precipitation
(inches) T1 departure from normal |
| B minimum mean temperature | U maximum calendar day precipitation (inches) |
| C monthly mean
temperature C1 departure from normal |
U1 date of maximum calendar day precipitation |
| D maximum temperature | V date(s) of maximum daily precipitation |
| E date(s) of maximum temperature | V1 maximum 24-hour precip. & date(s) |
| F minimum temperature | W number of days with precip. >= .01" |
| G date(s) of minimum temperature | X number of days with precip. >= 1.0" |
| H days with maximum temperature >=90 | Y year-to-date precipitation (inches) |
| I days with maximum temperature <=32 | Z maximum calendar day snowfall (inches) |
| J days with minimum temperature <=32 | VRB Variable |
| K days with minimum temperature <= 0 | 1 date of maximum calendar day snowfall (inches) |
| K1 average relative humidity | 2 number of days with snowfall |
| L peak wind gust (miles per hour) | 3 number of days with snowfall >= 1.0" |
| M direction of peak wind gust | 4 total snowfall for month (inches) |
| N date(s) of peak wind gust | 5 total snowfall for 2014-2015 season (inches) |
| N1 average wind speed (miles per hour) | 6 maximum barometric pressure (inches) |
| N2 dominant wind direction | 6A date of maximum barometric pressure |
| O number of days with thunder | 7 minimum barometric pressure (inches) |
| P number of days with hail | 7A date of minimum barometric pressure |
| Q number of days with glaze | 8 average sea-level pressure |
| R number of days with ice pellets | STN Station |
| NR not recorded | |
| R1 number of days with dense fog [1/4 mile and less visibility] | (i) incomplete data |
| S local observation time for temps/precipitation | (M) missing, if listed in data table |
| ~ "about" | E estimated |
| + additional indeterminate number of days | CWA - NWS Office County Warning Area |

For Weather
Headlines visit the National Weather Service Homepage
or conduct a Google.com
Search
http://www.weather.gov
National Weather
Service Web Sites & Current Email Addresses
Within or Nearby the
ACON VA/NC/SC Area Can Be Found At:
NWS
Washington/Baltimore, VA/MD
NWS Wakefield,
VA
NWS Blacksburg,
VA
NWS Raleigh,
NC
NWS Newport/Morehead City,
NC
NWS Wilmington,
NC
NWS Greenville-Spartanburg,
SC
NWS Columbia,
SC
NWS Charleston, SC
NWS
Morristown, TN
National Weather Service Homepages
National Climatic Data Center, Asheville, NC
STATION / LOCATION
(MILES & DIRECTION FROM MAIN POST OFFICE)/OBSERVER / YEAR RECORDS BEGAN /
EMAIL ADDRESS:
[ includes current stations, inactive
stations, and closed stations since database inception ]
| AKQ Wakefield, VA NWS Wakefield Municipal Airport 36-58-53N 077-00-04W 33M | SVC Seven Corner, Fairfax County, VA John Iekel Latitude 38.857404 Longitude -77.151696 |
| DCA
Arlington, VA Washington, DC, Reagan Washington National
Airport 38-50-54N 077-02-03W 18M |
WSH Washington, VA David Yowell runamok@runamok.com |
| BCB Blacksburg, VA NWS Virginia Tech Airport 37-13N 080-25W | |
| WOO Woodstock, VA 5NW Lauck Walton 12/1/85 STATION CLOSED 08/2014 | |
| LDY Ladysmith, VA Danny Jessee 2003 STATION CLOSED 8/31/2010 danny@dannyjessee.com | |
| BRI Bridgewater, VA Clayton Towers Ctowers19@aol.com | WAL Wallops Island, VA 37° 56'26" N 75° 27'47" W Wallops Flight Facility Airport |
| CEN Centreville,
VA Paul Bassett 1985, 38° 50.9788' N LAT. 77° 25.6374' W LON. | Elevation 324' | STATION CLOSED |
AVL Asheville, NC Asheville Regional Airport 35-25-55N 082-32-15W 670M |
| CHO
Charlottesville, VA Charlottesville-Albemarle Airport ASOS
(Rappahannock County) 38-08-18N 078-27-21W 192M |
MRH Beaufort, NC Michael J. Field Airport 34-44-01N 076-39-38W 3M |
| DAN Danville, VA, Danville Regional Airport, 36-34-22N 079-20 10W 175M | CLT Charlotte, NC NWS Charlotte/Douglas International Airport 35-12-48N 080-56-55W 220M |
| IAD Dulles - Washington-Dulles International Airport 38-56-05N 077-26-51W 93M | |
| FCH Falls Church, VA Erica Page 3/7/94 Windie1970@aol.com | HKY Hickory, NC |
| HAM Hampton, VA 5NE Dave Kessel 1989 kesseld1@cox.net | ECG Elizabeth City, NC, Coast Guard Air Station 36-15-47N 076 10-58W 11M |
| LYH Lynchburg, VA NWS Lynchburg Regional Airport 37-19-15N 079-12-24W 295M | ILM Wilmington, NC NWS New Hanover International Airport 34-16-06N 077-54-22W 9M |
| CTR Winterpock in Chesterfield County, VA Albert Arnold 06/03 | FAY Fayetteville, NC Fayetteville Regional Airport, 34-59-22N 078-52-48W 55M |
| GSO Greensboro, NC NWS Piedmont Triad International Airport 36-05-51N 079-56-37W 275M | |
| CHT Chantilly, VA Russ Topping - 12/2006 russ.topping@gmail.com | HSE Cape Hatteras, NC Mitchell Field 35-13-56N 075-27-21W 3M |
| HDV
Herndon, VA Randoplh W. Ashby, 3.3 SM South, Lat: 38.922127, Lon: -77.38015, Elev: 390'. 1993 randy_ashby@msn.com |
LBT Lumberton, NC Lumberton Municipal Airport 34-36-26N 079-03-36W 37M |
| GAV - Glen Allen, Henrico County, VA - Lowell Koontz 8/1/08 wwkoontz@verizon.net | EWN New Bern, NC Craven County Regional Airport 36-04-03N 077-02-50W 3M |
| MON Moncure, NC Chatham County - Mac McIlwain mac.mcilwain@embarqmail.com | |
| RAL Raleigh, NC 7NNW Bob Woodson - 6/1/93 kf4mmm@qsl.net | |
| LKU Louisa, VA 1N Joseph Bowers 1944 - NWS ID 44-5050-02 STATION CLOSED | RDU Raleigh-Durham, NC Raleigh-Durham International Airport 35-52-14N 078-47-11W 130M |
| LOU Louisa, VA 6S John Bullock (about 1970) STATION CLOSED | ROX Roxboro, NC 2SE Merriell A. Jay 1/93 ending 12/13 |
| WHI North Whiteville, NC Christopher Crawley 12/10 34.413744N / 078.751908W ccawley.kk4csr@gmail.com | |
| LYH Lynchburg, VA NWS Lynchburg Regional Airport 37-19-15N 079-12-24W 295M | ILM Wilmington, NC NWS New Hanover International Airport 34-16-06N 077-54-22W 9M |
| NEW Newmarket, VA 2W Joyce Winfree STATION CLOSED 5/31/10 | CHS Charleston, SC NWS Charleston Air Force Base 32-53-56N 080-02-26W 13M |
| CXM Downtown Charleston, SC NWS 32.77° N 79.93 W | |
| NPN Newport News, VA 7N Gary Leonard - 6/91 mikey0781@cox.net | CAE Columbia, SC NWS Columbia Metropolitan Airport 33-56-31N 081-07-05W 73M |
| NOR Norfolk, VA 3NE Jim Fentress 6/1/77 | FLO Florence, SC Florence Regional Airport 34-11-16N 079-43-51W 44M |
| ORF Norfolk, VA 5NE 36-54-13N 076-11-31W 14M 1871 | GSP Greenville-Spartanburg, SC NWS Greenville-Spartanburg Airport 34-53-02N 082-13-15W 286M |
| POR Portsmouth, VA 36.81° North 76.33° West 3S Bill Trotter - 7/1/76 wxr@cox.net | CRE North Myrtle Beach, SC Grand Strand Airport 33-48-42N 078-43-26W 10M |
| MEC Mechanicsville, VA Glen Martin 11/19/91 | OGB Orangeburg, SC Orangeburg Municipal Airport 33-27-50N 080-51-13W 59M |
| FHC Norfolk, VA Fred Heutte Center 36° 54'N 76° 16'W 01/01/03 fhcgarden@cox.net | AND Anderson, SC |
| RIC Richmond, VA Richmond International Airport 37-30-40N 077-19-24W 50M | TRI Tri-cities, TN (Bristol / Johnson / Kingsport), Tri-City Regional Airport 36-28-47N 082-23-56W 474M |
| ROA Roanoke, VA Roanoke Regional Airport 37-19-01N 079-58-27W 362M | DAV Davis, WV Dave Lesher canaanwx@yahoo.com |