
http://members.cox.net/wxr/acon.htm
SUMMARY OF CLIMATOLOGICAL DATA
SUMMARY OF CLIMATOLOGICAL DATA
 1981-2010 NORMALS
From Kevin Shaw:
" At long last, based on a great tip from my friend Rick Thoman up
in Alaska, here is a one stop shop for basic 1981-2010 normals information:
http://ggweather.com/normals/index.htm.
Also,
I happened to find this one myself, covering a lot of links to record
information:
http://illiniweather.com/pages/weather_record_links.htm.
1981-2010 NORMALS
From Kevin Shaw:
" At long last, based on a great tip from my friend Rick Thoman up
in Alaska, here is a one stop shop for basic 1981-2010 normals information:
http://ggweather.com/normals/index.htm.
Also,
I happened to find this one myself, covering a lot of links to record
information:
http://illiniweather.com/pages/weather_record_links.htm.
|
|
|
Temperature |
Average Temperature |
Average Temperature |
Precipitation |
Precipitation |
|
|
Dulles |
Blacksburg |
Arlington |
Blacksburg |
Norfolk (ORF) |
Centreville |
|
|
Fayetteville |
Roxboro |
Fayetteville |
Asheville |
Moncure |
Fayetteville |
|
|
Columbia |
Greenville-Spartanburg |
Charleston |
North Myrtle Beach |
Charleston |
Anderson |
STN A B C C1 D E F G H I J K K1 L M N N1 N2 O P Q R R1 S CWA
--------------------------------------------------------------------------------------------------------
BCB 85.7 64.3 75.0 +3.9 93 22 54 1 6 0 0 0 78% 27 040� 30 2.2 12 0 0 0 7 2400 AKQ
BRI 89.03 67.35 78.19 +3.89 99 28 56 16 15 0 0 0 64% 0 0 0 0 0 0510/1600 LWX
CEN 90.8 70.4 80.6 +3.9 102 22 60 2 19 0 0 0 59% 25 280� 13 1.5 315� 5 0 0 0 2 2400 LWX
CHT 92.7 70.4 81.6 +5.2 103.9 22 59.6 2 23 0 0 0 69% 16 158� 16 0.2 180� 4 0 0 0 0 2400 LWX
CHO 92.1 69.0 80.5 102 22 57 15 22 0 0 0 43 320� 3 2.6 5 0 0 0 4 2400 LWX
DAN 91.7 68.1 79.9 +1.1 100 29 58 1,15 22 0 0 0 72% 38 090� 30 4.1 8 0 0 0 3 2400 RNK
DCA 93.6 75.4 84.5 +5.3 104 29 67 16 25 0 0 0 59% 52 330� 3 7.2 7 0 0 0 0 2400 LWX
IAD 92.8 69.1 81.0 +5.3 105 22 56 2 24 0 0 0 64% 39 030� 13 5.3 4 0 0 0 2 2400 LWX
GAV 92.13 70.90 81.52 102 22 61 15 22 0 0 0 67% 37 023� 3 6 0 0 0 0 2400 AKQ
HDV 91.2 69.1 80.1 +3.1 100 22 58 2 21 0 0 0 70% 21 315� 13 180� 6 0 0 0 1 2400 LWX
LYH 90.7 66.4 78.6 +3.5 100 22 56 15 19 0 0 0 71% 40 240� 13 2.7 10 0 0 0 5 2400 RNK
HAM 2400 AKQ
NPN 92.2 72.0 81.2 +0.9 103.6 23 59.6 15 21 0 0 0 38 180� 6 2.2 225� 7 0 0 0 0 2400 AKQ
FHC 91.05 73.55 82.30 +3.2 102.3 22 63.7 15 20 0 0 0 69% 32 226� 7 1.4 203� 0 0 0 0 2400 AKQ
NOR 90.6 71.3 80.9 +1.8 101 22 60 15 18 0 0 0 7 0 0 0 0 2400 AKQ
ORF 90.8 73.7 82.3 +3.2 103 23 67 16 15 0 0 0 68% 49 200� 4 6.9 11 0 0 0 1 2400 AKQ
POR 91.4 70.6 81.0 +1.7 102.4 22 59.6 15 20 0 0 0 77% 30 248� 25 2.3 155� 7 0 0 0 1 2400 AKQ
CTR 90.4 68.6 78.5 +0.6 98.0 22 56.3 15 20 0 0 0 79% 25 090� 4 0.0 212� 3 0 0 0 0 2400 AKQ
MEC 91.70 69.90 81.0 100 22 59 15 17 0 0 0 8 0 0 0 0 1700 AKQ
RIC 92.8 71.1 82.0 +2.7 103 29 61 15 23 0 0 0 67% 53 160� 4 5.4 8 0 0 0 0 2400 AKQ
ROA 90.5 69.9 80.2 +4.0 99 21,29 59 1 18 0 0 0 65% 75 300� 4 4.4 10 1 0 0 1 2400 AKQ
WAL 89.1 72.1 80.6 +4.0 100 22 61 15 12 0 0 0 37 250� 4 7.0 1 0 0 0 2 2400 AKQ
WOO 86.3 69.0 77.7 +3.0 96 23 61 1 9 0 0 0 5 0 0 0 2 2400 LWX
WSH 88.1 67.6 77.8 +2.23 97.6 22 58 16 12 0 0 0 79% 18 068� 3 0.2 225� 7 0 0 0 0 2400 LWX |
STN A B C C1 D E F G H I J K K1 L M N N1 N2 O P Q R R1 S CWA
-------------------------------------------------------------------------------------------------------
AVL 86.7 67.0 76.9 +3.9 92 20,30 60 1 11 0 0 0 73% 39 240� 4 3.7 7 0 0 0 7 2400 GSP
MRH 89.1 77.8 83.5 98 30 68 17,18 11 0 0 0 41 200� 9 10.5 6 0 0 0 0 2400 MHX
CLT 92.8 70.7 81.8 +1.5 101 30 63 2 25 0 0 0 69% 47 330� 13 4.6 8 0 0 0 0 2400 GSP
ECG 91.7 72.7 82.2 +2.4 101 29 66 17,18 20 0 0 0 71% 38 220� 6 7.4 7 0 0 0 4 2400 AKQ
FAY 96.2 73.3 84.8 105 30 64 16,16 30 0 0 0 62% 41 320� 24 6.4 11 0 0 0 0 2400 RAH
GSO 90.9 71.2 81.0 +3.1 98 29 65 1,2 20 0 0 0 67% 48 300� 24 5.2 13 0 0 0 1 2400 RAH
HSE 87.5 76.9 82.2 +3.0 94 30 68 18 5 0 0 0 73% 38 260� 24 8.7 0 0 0 0 0 2400 MHX
HKY 89.8 70.2 80.0 +2.3 97 29 62 15,16 21 0 0 0 43 230� 3 2.7 13 0 0 0 5 2400 GSP
LBT 93.9 73.0 83.5 +4.3 101 21,30 66 17,18 25 0 0 0 70% 46 160� 22 4.5 2 0 0 0 3 2400 ILM
EWN 92.8 72.6 82.7 +2.4 102 29 63 16,17 24 0 0 0 71% 39 210� 24 5.8 9 0 0 0 1 2400 MHX
MON 92.4 70.4 81.4 +2.2 101.0 23 61.4 2 21 0 0 0 75% 26 225� 25 0.3 225� 8 0 0 0 1 2400 RAH
RDU 95.3 72.0 83.7 +4.9 104 29 60 15 24 0 0 0 62% 64 210� 30 5.4 14 0 0 0 0 2400 RAH
RAL 94.0 70.9 82.5 +3.7 104 29 61 15,16 24 0 0 0 27 24 8+0 0 0 0 2400(T)/1930(P) RAH
ROX 92.5 70.4 81.6 +5.2 100 22,29 57.0 15 24 0 0 0 69% 34 360� 23 070� 6 0 0 0 l 2200 RAH
WHI 94.4 72.1 83.2 +3.3 102.3 30 63.4 17 24 0 0 0 72% 36 217� 13 2.0 179� 7 0 0 0 2 2400 ILM
ILM 92.1 73.3 82.7 +1.6 102 13 63 17 17 0 0 0 71% 44 310� 13 7.1 12 0 0 0 1 2400 ILM
|
STN A B C C1 D E F G H I J K K1 L M N N1 N2 O P Q R R1 S CWA
-------------------------------------------------------------------------------------------------------
AND 93.9 72.0 83.0 +3.3 100 30 66 15 27 0 0 0 39 190� 20 4.6 13 0 0 0 3 2400 GSP
CAE 96.4 74.6 85.5 +3.5 104 22,23 68 18 29 0 0 0 64% 46 270� 6 4.4 11 0 0 0 1 2400 CAE
46 300� 25
CRE 88.7 74.4 81.5 +2.0 96 13 66 17,18 10 0 0 0 77% 38 270� 24 9.0 4 0 0 0 2 2400 ILM
CHS 92.5 74.9 88.7 +1.6 99 13,22 66 18 24 0 0 0 59 230� 9 7.2 10 0 0 0 1 2400 CHS
43 280� 23
FLO 95.4 72.7 84.0 +2.9 102 22 65 17,18 27 0 0 0 69% 36 290� 5 5.7 7 0 0 0 6 2400 ILM
GSP 92.9 71.4 82.2 +3.4 99 12 64 16 27 0 0 0 68% 29 030� 19 4.5 11 0 0 0 2 2400 GSP
OGB 95.1 72.9 84.0 +2.2 102 20,22 66 18 28 0 0 0 39 050� 31 4.4 0 0 0 0 2 2400 CAE |
STN A B C C1 D E F G H I J K K1 L M N N1 N2 O P Q R R1 S CWA
---------------------------------------------------------------------------------------------------------
TRI 89.4 67.7 78.6 +4.4 95 11 57 1 20 0 0 0 39 310� 23 2.0 12 0 0 0 6 2400 MRX
DAV 68 88 71 50 1 0 0 0 0 0700 PBZ |
     STN  T      T1      U  U1    V    V1   W X   Y      Z  1   2 3    4    5     6   6A   7    7A    8    S
     ---------------------------------------------------------------------------------------------------------
     BCB  3.78  -0.39  2.01  8  2.01     8  9 1 27.25                0.0  8.2                             2400
     BRI  2.04  -2.01  0.74  8  0.76   8-9  6 0 28.40                0.0 11.3  30.212 18 29.83  26        0510/1600
     CEN  1.20  -2.47  0.41 25  0.41    25  6 0 20.93                0.0 13.8  30.23  17 29.75  26 29.99  2400
     CHT  2.21  -1.36  1.11  8  1.11     8  7 0 22.55                0.0 14.5  30.190 17 29.695 26 29.924 2400
     CHO  2.87         1.07  8  1.07     8  8 1 24.28                                    29.71   8        2400
     DAN  3.88  -0.56  2.17  8  2.21   8-9  8 3 21.40                0.0 11.0  30.24  17 29.71   8        2400
     DCA  3.03  -0.63  1.05 13  1.05    13  6 1 17.38                0.0 10.1            29.71   8
     IAD  2.58  -0.99  1.27  8  1.27     8  6 1 19.96                0.0 10.1            29.71   8        2400
     GAV  3.69         1.71  8  1.72   8-9  9 1 21.95                0.0  9.4  30.22  17 29.71   8 29.93  2400
     HDV  4.13  +0.38  1.52 25              5 3 24.39                0.0 14.5  30.17  17 29.68  26        2400
     LYH  2.99  -1.40  1.39 13  1.39    13 10 1 21.60                0.0  8.4  30.26  17 29.75   8        2400
     HAM                                                                                                  2400
     NPN 10.32  +4.80  2.63  9  4.67   8-9  8 4 33.43                0.0 16.7  30.23  17 29.69  25        2400
     FHC  7.24  +1.98  1.69 23  2.83   6-7  9 4 26.65                0.0 18.0  30.242 17 29.706 25 29.959 2400
     NOR  8.33  +3.07  2.12 31  2.12    31 10 4 25.75                0.0 21.0                             2400
     ORF 10.89  +5.72  2.37 24  4.49 24-25 10 6 27.52                0.0 21.8  30.23  17 29.70  25        2400
     POR  3.96  -1.27  0.99  6  0.99     6  8 0 22.89                0.0 19.0  30.24  17 29.71  25 29.950 2400
     CTR  8.82  +4.51  2.82  3  3.14   8-9 12 3 26.63                0.0 12.1  30.21  17 29.69  25 29.919 2400
     MEC  7.48         3.04  9  3.04     9 12 3 29.72                0.0 10.8  29.97 16, 29.56   8 28.77  2400
                                                                                      17
     RIC  3.63  -0.88  1.72  8  1.73   8-9  9 1 22.49                0.0 10.8  30.25  17 29.72  25        2400
     ROA  3.76  -0.24  1.48  4  1.48     4  6 1 23.64                0.0 10.4  30.25  17 29.75   8        2400
     WAL  2.83  -0.73  1.28  8  1.58   8-9 10 1 17.57                0.0 17.0  30.23  17 29.70  26        2400
     WOO  1.49  -2.51           0.66   7-8  7 0 26.04                0.0 12.8  30.24  17 29.89  26        0800
WSH 2.83 -1.22 1.32 3 1.32 3 9 1 27.73 0.0 14.7 30.23 17 29.77 26 2400 |
     STN  T      T1      U  U1    V    V1   W X   Y      Z    1 2  3   4    5     6    6A   7    7A    8     S
     ----------------------------------------------------------------------------------------------------------
     AVL  3.33  -0.54  1.82  8  1.82     8 11 1 26.48                 0.0 20.8  30.25  17 29.75   8         2400
     MRH  2.46         0.93  8  1.21   7-8 10 0 20.75                 0.0    T  30.23  17 29.76  13         2400
     CLT  3.53  -0.26  1.64 30  1.66 30-31  9 1 24.00                 0.0  8.9  30.25  17 29.74   8         2400
     ECG  4.52  -0.43  3.27  6  3.27     6 11 1 17.77                 0.0       30.24  17 29.73  25         2400
     FAY  1.87         1.14  5  1.40   5-6  7 1 16.71                                     29.74   8         2400
     GSO  3.55  -0.89  1.66  8  1.73   8-9 10 1 20.85                 0.0  9.9            29.74   8         2400
     HSE  6.19  -1.24  2.07 25  2.60 25-26  8 2 24.69                 0.0  6.0  30.23  17 29.76  26         2400
     HKY  5.96  +1.79  2.34  7  2.45   7-8 14 2 26.95                 0.0    T  30.22  17 29.71   8         2400
     LBT  4.61  -1.00  2.23  5  2.76   4-5 11 1 20.65                 0.0       30.22  17 29.73  13         2400
     EWN  3.04  -3.44  0.81  8  1.08   7-8 10 0 16.22                 0.0  4.4  30.24  17 29.76  13         2400
     MON  6.38  +1.56  1.35 25  1.78 30.31 10 2 20.74                 0.0 16.9  30.235 17 29.745  8  29.990 2400
     RDU  5.49  +1.20  1.38  4  3.25 30-31  8 3 20.51                 0.0  9.0            29.74   8         2400
     RAL  3.84  -0.45           0.96 29-30  9+0 20.52                 0.0  9.1  30.14  16 29.76   9         0730
     ROX  5.71  +1.12  3.29  6  3.29     6  8 2 25.54                 0.0 11.7  30.32  17 29.82   8  30.07  2200
     WHI  7.64  +2.11  2.86  9  2.95  9-10 11 3 27.78                 0.0  9.2  30.219 17 29.732 13  29.969 2400
ILM 3.53 -4.09 1.35 25 1.70 25-26 11 2 18.49 0.0 4.0 30.22 17 29.73 13 2400 |
     STN  T      T1     U  U1   V    V1   W X   Y     Z   1  2 3  4     5     6     6A   7    7A    8     S
     -------------------------------------------------------------------------------------------------------
     AND  2.08  -1.55 0.74  5  0.75   5-6  9 0 19.79               0.0    T  30.23  17 29.73   8         2400
     CAE  6.17  +0.63 1.09  6  2.09   5-6 11 2 24.73               0.0  4.8  30.21  17 29.76  25         2400
     CRE  2.97  -2.22 0.98 26  1.63 25-26  8 0 19.10               0.0       30.21  17 29.75  13         2400
     CHS  6.94  +0.41 2.71  9  2.71     9 12 3 21.50               0.0  0.2  30.14  23 29.81  26         2400
     FLO  4.61  -0.67 2.34  5  2.34     5  0 0 18.77               0.0       30.21  17 29.76  13         2400
     GSP  5.23  +0.58 2.01 25  2.01    25 10 1 27.38               0.0  8.6  30.23  17 29.72   8         2400
     OGB  4.99  -0.30 3.56 26  3.58 25-26  7 1 23.18                         30.20  17 29.78  25         2400
|
     STN  T      T1     U  U1   V      V1  W X   Y      Z  1  2  3   4      5     6   6A   7    7A 8      S
     --------------------------------------------------------------------------------------------------------
     TRI  3.85  -0.36 1.37 22 2.47 22-23 11 2 30.53              0   0.0  15.6  30.20 17 29.73   8        2400
     DAV  5.60   0.0  1.21 14            16 3 49.6               0   0.0 215.0                            0700
|
Virginia:
Arlington - " THE MAIN STORY THIS JULY WAS THE RECORD HEAT. THE FOLLOWING IS A COMPILATION OF SOME OF THE MANY RECORDS THAT WERE BROKEN AT WASHINGTON DC THIS MONTH... JULY 2011 WAS THE HOTTEST JULY AND HOTTEST MONTH ON RECORD. THE MONTHLY AVERAGE TEMPERATURE OF 84.5F SMASHED THE PREVIOUS HOTTEST JULY/MONTH AVERAGE OF 83.1F SET IN JULY 2010 AND JULY 1993. THE MAX TEMPERATURE AVERAGED 93.6F FOR THE MONTH...WHICH WAS THE HIGHEST MAX TEMPERATURE FOR JULY AND FOR ANY MONTH. THE PREVIOUS RECORD WAS 92.8F SET IN JULY 1999. THE MIN TEMPERATURE AVERAGED 75.4F FOR THE MONTH...WHICH WAS THE WARMEST MIN TEMPERATURE FOR JULY AND FOR ANY MONTH. THE PREVIOUS RECORD WAS 73.9F SET LAST JULY 2010. THE MIN TEMPERATURE DID NOT DROP BELOW 67F DURING THE ENTIRE MONTH FOR THE FIRST TIME ON RECORD. TWO NEW DAILY RECORD HIGHS WERE SET...102F ON THE 23RD AND 104F ON THE 30TH. A MAX TEMPERATURE OF 104F ON JULY 29TH WAS TIED FOR THE 5TH ALL-TIME HIGHEST DAILY TEMPERATURE ON RECORD. THE HOTTEST DAY IN WASHINGTON ON RECORD IS 106F ON JULY 20TH 1930 AND AUGUST 6TH 1918. JULY 2011 HAD THE MOST NUMBER OF DAYS OF 90F OR HIGHER IN ANY MONTH...WHEN TEMPERATURES OF 90F OR HIGHER WERE RECORDED ON 25 DAYS. PREVIOUS HIGHEST NUMBER OF DAYS HITTING 90F OR BETTER WAS 24 IN JULY 1987 AND JULY 1993. A NEW RECORD WAS SET FOR THE NUMBER OF CONSECUTIVE DAYS WHERE THE TEMPERATURE DID NOT DROP BELOW 80F...4 DAYS FROM THE 21ST THROUGH THE 25TH. THIS JULY ALSO FEATURED THE MOST NUMBER OF DAYS FOR ANY MONTH WHERE THE TEMPERATURES STAYED AT OR ABOVE 80F IN WASHINGTON DC...7. NOTE...ALL CLIMATE DATA AND RECORDS DISCUSSED ABOVE ARE PRELIMINARY UNTIL THE CLIMATE DATA ARE REVIEWED AND PUBLISHED BY THE NATIONAL CLIMATIC DATA CENTER. " - [ + - ] - Notes from NWS Sterling, VA
Bridgewater - " The month was hot and dry. For the first nine days, 1.67 inches of rain. On the last twenty-two days, only .37 inches occurred. There were 15 days with temperatures of 90 degrees or above. In spite of the dry weather in July, the precipitation for the year is 6.03 inches above normal. " - [ + - ] - additional notes from Clayton
Chantilly - Russ sends these additional notes: " HOT HOT HOT! July 2011 was the hottest month ever recorded at this station, with the mean monthly temperature of 81.6�, mean high temperature of 92.7� and mean low temperature of 70.4�. Temperatures averaged 5.2� above normal. Temperatures exceeded 90� a record 23 times. A record high temperature was set on the 22nd (103.9�) and 29th (101.3�). A record high low temp was set on the 12th (72.2�) and 21st (76.8�). A record high low temp was set on the 20th (75.5�), 22nd (77.6�), 23rd (77.7�), 24th (79.8� - extreme event for July), 27th (74.2�) and 30th (76.4�). Precipitation was 1.36" below normal. Thunder was observed on the 11th. Thunderstorms rolled through on the 3rd, 8th, 13th and 25th. *Please note, anemometer is currently partially obstructed from the North and East " - [ + - ]
Dulles - from NWS Sterling (KLWX): " THE MAIN STORY THIS JULY WAS THE RECORD HEAT. THE FOLLOWING IS A COMPILATION OF SOME OF THE MANY RECORDS THAT WERE BROKEN AT DULLES THIS MONTH... JULY 2011 WAS THE HOTTEST JULY AND HOTTEST MONTH ON RECORD. THE MONTHLY AVERAGE TEMPERATURE OF 81.0F SMASHED THE PREVIOUS HOTTEST JULY/MONTH AVERAGE OF 79.7F SET IN JULY 1993. THE MAX TEMPERATURE AVERAGED 92.8F FOR THE MONTH...WHICH WAS THE HIGHEST MAX TEMPERATURE FOR JULY AND FOR ANY MONTH. THE PREVIOUS RECORD WAS 92.5F SET LAST JULY 2010. THE MIN TEMPERATURE AVERAGED 69.1F FOR THE MONTH...WHICH WAS THE SECOND WARMEST MIN TEMPERATURE FOR JULY...SECOND ONLY TO 69.4F IN JULY 1994. TWO DAILY RECORD MAX TEMPERATURES WERE BROKEN...105F ON THE 22ND AND 103F ON THE 29TH...AND ONE WAS TIED...99F ON THE 23RD. THREE DAILY RECORD HIGH MIN TEMPERATURES WERE BROKEN THIS JULY... 76F ON THE 22ND...76F ON THE 23RD AND 76F ON THE 30TH...AND ONE WAS TIED...75F ON THE 20TH. THE READING OF 105F ON JULY 22ND WAS THE HIGHEST TEMPERATURE EVER RECORDED AT DULLES. THIS BROKE THE PREVIOUS RECORD OF 104F SET ON JULY 16TH 1988 AND AUGUST 20TH 1983. JULY 2011 HAD THE MOST NUMBER OF DAYS OF 90F OR HIGHER IN ANY MONTH...WHEN TEMPERATURES OF 90F OR HIGHER WERE RECORDED ON 24 DAYS. THE PREVIOUS HIGHEST NUMBER OF DAYS HITTING 90F OR BETTER WAS 21 IN JULY 1987...JULY 1988 AND JULY 1999. DULLES RECORDED THREE DAYS OF TEMPERATURES REACHING 100F THIS JULY...WHICH IS TIED FOR THE MOST IN ONE MONTH WITH JULY 1980 AND JULY 1988. " - [ + - ]
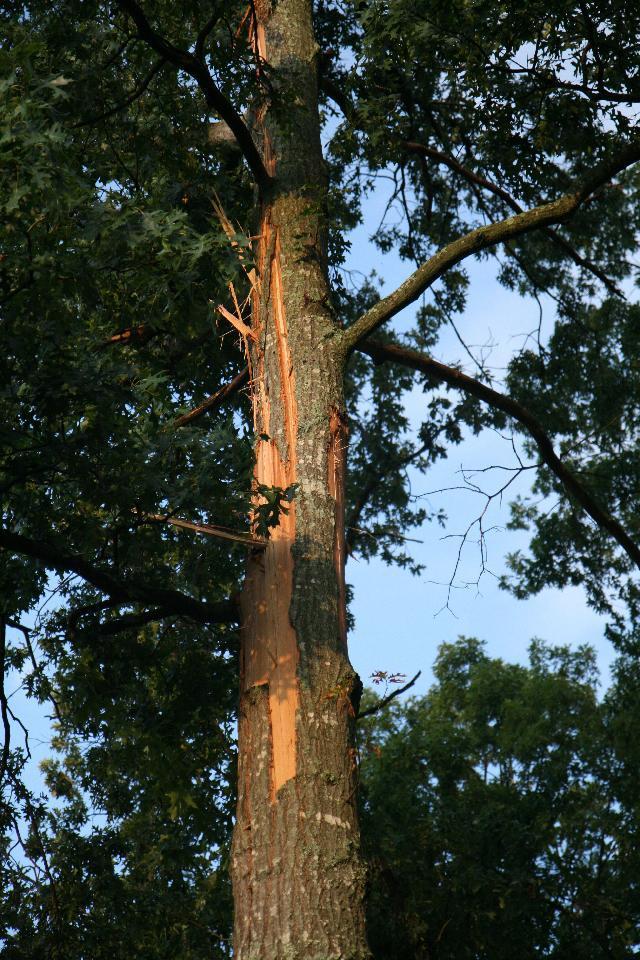
Glen Allen - Lowell Koontz reports: " July was extremely hot again this year. The Richmond International Airport had a mean monthly average of 82.1�F which was only 0.7�F less than last year, which was the hottest July since temperature records were started in 1880. The July mean average temperature here was 81.5�F a +5.1�F departure when compared to Ashland's average. July's mean was only 0.5�F less this year when compared to last July. The 3.69 inches of rainfall for July at Glen Allen was a -0.66 inch departure when compared to Ashland's average. The Richmond International Airport had 3.63 inches and was the 47th driest from 1887 to 2011. July had 9 days with measurable rain with 1.71 inches or 46% of the month's rainfall occurring on the 8th. The Richmond International Airport had 1.72 inches on the 8th, which is now a new daily record amount there. At Glen Allen July had 22 days with 90�F or above temperatures the same as last year. The maximum temperature for July was 102�F recorded on July 22nd which is the second highest maximum temperature ever recorded here. But with the high relative humidity the heat index hit 117.6�F at 1358; this was higher than any reading last year. The Airport had 103�F on the 29th, which set a daily maximum temperature record for the date. They also set three daily high minimum temperature records on the 12th, 22nd, and 30th. The minimum temperature on the 12th was 81�F, which makes it the warmest night ever recorded for Richmond, Virginia. On 20 nights the minimum temperature was 70�F or higher at the Airport. A wind gust of 35 mph on the 3rd is thought to be the strongest wind gust recorded for July that occurred in a thunderstorm in which lightning hit within 50 feet of my weather station and destroyed the anemometer. (see pic with a click here) The other equipment damaged was a Davis transmitter module #6152 which included the sun, rain, wind, temperature and relative humidity. The wireless leaf and soil moisture/temperature transmitter #6345 and both leaf wetness sensors, solar radiation sensor, temperature/relative humidity sensor, intercom system were destroyed. It also damaged two thermometers that monitored soil temperature and leaf wetness sensor temperature. As of July 30th the Glen Allen Weather Station is back to full operation. [Editor's note: Lowell also included a spreadsheet of the changes in normals for Richmond (RIC) from 1980 to 2010. You can view his work here. " - [ + - ]
Herndon - Randy sends these additional notes: " July was above normal for temperature and precipitation. The temperatures ranged between a high of 100 and a low of 58. The average highs/lows were 4.5 and 1.8 degrees above normal, respectively. This was the hottest July that I have ever recorded at this location. On the precipitation side, the numbers were very misleading. The month was 0.38" above normal with 4.13" measured. However, we only had rain on five widely scattered days with three days accounting for 94% of the month's rain. The rest of the month was very dry. The heaviest rain (1.52") came on the 25th; for the year now we are 2.3" below normal. " - [ + + ]
Portsmouth - " July's average temperature (81.0�) was 1.7� ABOVE NORMAL. Rainfall was BELOW NORMAL by 1.27" and was 76% of normal relative to normal Julys for the period from 1976 to 2010. Frontal passages were noted on the 9th, 13th, 26th and 30th. Station Records: 6th - RAINFALL 0.99" [previous 0.49" 1981]; 15TH - TEMPERATURE Minimum 60� [previous 61� 2009]; 16TH - TEMPERATURE Minimum 62� [previous 66� in 1981]; 22ND - TEMPERATURE Maximum 102� [previous 99� in 1998]; 23RD - TEMPERATURE Maximum 102� [previous 100� in 2010]. " - [ + - ]
North Carolina:
Greensboro - NWS RAH notes: " THE AVERAGE TEMPERATURE FOR JULY AT PIEDMONT TRIAD INTERNATIONAL AIRPORT WAS 81.1. THIS IS THE SECOND WARMEST JULY ON RECORD. THE LOW TEMPERATURE JULY 12 AT PIEDMONT TRIAD INTERNATIONAL AIRPORT WAS 78 DEGREES. THIS TIES THE ALL TIME RECORD HIGH MINIMUM PREVIOUSLY SET IN 2010. THE LOW TEMPERATURE JULY 12 AT PIEDMONT TRIAD INTERNATIONAL AIRPORT WAS 78 DEGREES. THIS BREAKS THE OLD RECORD OF 76 LAST SET IN 2005. THE LOW TEMPERATURE JULY 21 AT PIEDMONT TRIAD INTERNATIONAL AIRPORT WAS 76 DEGREES. THIS BREAKS THE OLD RECORD OF 74 LAST SET IN 2010. THE LOW TEMPERATURE JULY 22 AT PIEDMONT TRIAD INTERNATIONAL AIRPORT WAS 77 DEGREES. THIS BREAKS THE OLD RECORD OF 76 LAST SET IN 2010. THE LOW TEMPERATURE JULY 30 AT PIEDMONT TRIAD INTERNATIONAL AIRPORT WAS 77 DEGREES. THIS BREAKS THE OLD RECORD OF 74 DEGREES SET IN 1931. " - [ + - ]
Raleigh - NWS RAH notes: " THE AVERAGE TEMPERATURE FOR JULY AT RALEIGH-DURHAM INTERNATIONAL AIRPORT WAS 83.7. THIS IS THE WARMEST JULY ON RECORD ... BREAKING THE PREVIOUS RECORD OF 82.5 SET IN 1993. FIVE CONSECUTIVE DAYS OF HIGH TEMPERATURES OVER 100 DEGREES WERE RECORDED AT RALEIGH-DURHAM INTERNATIONAL AIRPORT JULY 20 THROUGH JULY 24. THIS BREAKS THE OLD RECORD OF FOUR CONSECUTIVE DAYS LAST SET JUNE 7 THROUGH JUNE 10 OF 2008. THE HIGH TEMPERATURE JULY 4 AT RALEIGH-DURHAM INTERNATIONAL AIRPORT WAS 99 DEGREES. THIS TIES THE OLD RECORD OF 99 DEGREES SET IN 2002. THE HIGH TEMPERATURE JULY 12 AT RALEIGH-DURHAM INTERNATIONAL AIRPORT WAS 100 DEGREES. THIS BREAKS THE OLD RECORD OF 98 SET IN 1986. THE HIGH TEMPERATURE JULY 20 AT RALEIGH-DURHAM INTERNATIONAL AIRPORT WAS 100 DEGREES. THIS TIES THE OLD RECORD OF 100 DEGREES SET IN 1977. THE HIGH TEMPERATURE JULY 21 AT RALEIGH-DURHAM INTERNATIONAL AIRPORT WAS 102 DEGREES. THIS TIES THE OLD RECORD OF 102 SET IN 1952. THE HIGH TEMPERATURE JULY 22 AT RALEIGH-DURHAM INTERNATIONAL AIRPORT WAS 103 DEGREES. THIS TIES THE OLD RECORD OF 103 DEGREES SET IN 1952. THE HIGH TEMPERATURE JULY 24 AT RALEIGH-DURHAM INTERNATIONAL AIRPORT WAS 101 DEGREES. THIS BREAKS THE OLD RECORD OF 100 DEGREES LAST SET IN 2010. THE HIGH TEMPERATURE JULY 29 AT RALEIGH-DURHAM INTERNATIONAL AIRPORT WAS 104 DEGREES. THIS TIES THE OLD RECORD OF 104 SET IN 1952. THE LOW TEMPERATURE JULY 3 AT RALEIGH-DURHAM INTERNATIONAL AIRPORT WAS 72 DEGREES. THIS TIES THE OLD RECORD HIGH MINIMUM LAST SET IN 1997. THE LOW TEMPERATURE JULY 12 AT RALEIGH-DURHAM INTERNATIONAL AIRPORT WAS 78 DEGREES. THIS BREAKS THE OLD RECORD OF 75 LAST SET IN 2005. THE LOW TEMPERATURE JULY 21 AT RALEIGH-DURHAM INTERNATIONAL AIRPORT WAS 77 DEGREES. THIS BREAKS THE OLD RECORD OF 76 LAST SET IN 1995. THE LOW TEMPERATURE JULY 22 AT RALEIGH-DURHAM INTERNATIONAL AIRPORT WAS 78 DEGREES. THIS BREAKS THE OLD RECORD OF 76 DEGREES LAST SET IN 1991. THE LOW TEMPERATURE JULY 23 AT RALEIGH-DURHAM INTERNATIONAL AIRPORT WAS 78 DEGREEES. THIS BREAKS THE OLD RECORD OF 76 DEGREES LAST SET IN 2010. THE LOW TEMPERATURE JULY 24 AT RALEIGH-DURHAM INTERNATIONAL AIRPORT WAS 79 DEGREES. THIS TIES THE OLD RECORD OF 79 SET IN 2010. THE LOW TEMPERATURE JULY 30 AT RALEIGH-DURHAM INTERNATIONAL AIRPORT WAS 75 DEGREES. THIS TIES THE OLD RECORD OF 75 DEGREES LAST SET IN 2008. " - [ + + ]
Raleigh - Bob reports: " TEMPERATURES SOARED IN JULY WITH THE 100 DEGREES OR HIGHER RECORDED ON SEVEN DAYS. HOWEVER, PRECIPITATION WAS BELOW NORMAL WITH 3.84". FOR THE YEAR, PRECIPITATION IS 5.21" BELOW NORMAL. NO SEVERE WEATHER WAS OBSERVED AT THIS STATION. " - [ + - ]
Moncure - Mac adds these notes: " Very Hot!! Humidity Oppressive!. While rain total is great, too late and widely sporadic. Trees began dropping leaves in early July, 2 months early. Average Noon-6PM Heat Index 101.8, High 117.6. 30YR DATA BASED ON 30YR CLIMATOLOGICAL DATA, SANFORD 8 NE, NC. STATION #317656, CLIMATE DIV " - [ + + ]
North Whiteville - Christopher reports: " " - [ + - ]
Nearby Cities:
Tri-Cities, TN - from NWS Morristown, TN: " The monthly-averaged temperature at Tri-Cities in July was 78.6 degrees which was 4.4 degrees above normal. It ranked as the 2nd warmest July on record. A record high temperature was tied on the 11th when the temperature peaked at 95 degrees tying the previous record set in 1988. The warmest July at Tri-Cities was back in 1993 when the average temperature was 79.6 degrees. Tri-Cities received 3.85 inches of rain in July, which was 0.36 inches below normal. It ranked as the 29th driest July on record. Measurable rain occurred on only 11 days and only three of those days had more than one-quarter of an inch of precipitation. The heaviest rain fell on the 22nd when 1.37 inches of rain was reported. More than an inch of rain fell on the next day as well when 1.10 inches was recorded. The driest July of the 73 years of observations taken at Tri-Cities was in 1995 when only 0.67 inches of rain was recorded. " - [ + - ]
Davis, WV - from Dave Lesher's website: " July 2011 had a mean temperature of 68�. The month's rainfall total of 5.6 inches was NORMAL. Rainfall for the year of 49.6" was 15.3" ABOVE NORMAL. " - [ M +/- ]
COLUMN DENOTATIONS:
| A maximum mean temperature | T total precipitation (inches)
T1 departure from normal |
| B minimum mean temperature | U maximum calendar day precipitation (inches) |
| C monthly mean temperature
C1 departure from normal |
U1 date of maximum calendar day precipitation |
| D maximum temperature | V date(s) of maximum daily precipitation |
| E date(s) of maximum temperature | V1 maximum 24-hour precip. & date(s) |
| F minimum temperature | W number of days with precip. >= .01" |
| G date(s) of minimum temperature | X number of days with precip. >= 1.0" |
| H days with maximum temperature >=90 | Y year-to-date precipitation (inches) |
| I days with maximum temperature <=32 | Z maximum calendar day snowfall (inches) |
| J days with minimum temperature <=32 | VRB Variable |
| K days with minimum temperature <= 0 | 1 date of maximum calendar day snowfall (inches) |
| K1 average relative humidity | 2 number of days with snowfall |
| L peak wind gust (miles per hour) | 3 number of days with snowfall >= 1.0" |
| M direction of peak wind gust | 4 total snowfall for month (inches) |
| N date(s) of peak wind gust | 5 total snowfall for 2007-2008 season (inches) |
| N1 average wind speed (miles per hour) | 6 maximum barometric pressure (inches) |
| N2 dominant wind direction | 6A date of maximum barometric pressure |
| O number of days with thunder | 7 minimum barometric pressure (inches) |
| P number of days with hail | 7A date of minimum barometric pressure |
| Q number of days with glaze | 8 average sea-level pressure |
| R number of days with ice pellets | STN Station |
| NR not recorded | |
| R1 number of days with dense fog [1/4 mile and less visibility] | (i) incomplete data |
| S local observation time for temps/precipitation | (M) missing, if listed in data table |
| ~ "about" | E estimated |
| + additional indeterminate number of days | CWA - NWS Office County Warning Area |

For Weather Headlines
visit the National Weather Service Homepage
or conduct a Google.com Search
http://www.weather.gov
National
Weather Service Web Sites & Current Email Addresses
Within or
Nearby the ACON VA/NC/SC Area Can Be Found At:
NWS Washington/Baltimore,
VA/MD
NWS Wakefield, VA
NWS Blacksburg, VA
NWS Raleigh, NC
NWS Newport/Morehead City, NC
NWS Wilmington, NC
NWS Greenville-Spartanburg, SC
NWS Columbia, SC
NWS Charleston, SC
NWS Morristown, TN
National Weather Service Homepages
National Climatic Data Center, Asheville, NC
STATION / LOCATION (MILES & DIRECTION FROM MAIN POST OFFICE)/OBSERVER / YEAR RECORDS BEGAN / EMAIL ADDRESS:
| AKQ Wakefield, VA NWS Wakefield Municipal Airport 36-58-53N 077-00-04W 33M | |||
| DCA Arlington, VA Washington, DC, Reagan Washington National Airport 38-50-54N 077-02-03W 18M | WSH Washington, VA David Yowell runamok@runamok.com | ||
| BCB Blacksburg, VA NWS Virginia Tech Airport 37-13N 080-25W | |||
| WOO Woodstock, VA 5NW Lauck Walton 12/1/85 jwalton@shentel.net | |||
| LDY Ladysmith, VA Danny Jessee 2003 STATION CLOSED 8/31/2010 danny@dannyjessee.com | |||
| BRI Bridgewater, VA Clayton Towers Ctowers19@aol.com | WAL Wallops Island, VA 37� 56'26" N 75� 27'47" W Wallops Flight Facility Airport | CEN Centreville, VA Paul Bassett 1985, 38� 50.9788' N LAT. 77� 25.6374' W LON. | Elevation 324' | m.psb@verizon.net | AVL Asheville, NC Asheville Regional Airport 35-25-55N 082-32-15W 670M |
| CHO Charlottesville, VA Charlottesville-Albemarle Airport ASOS (Rappahannock County) 38-08-18N 078-27-21W 192M | MRH Beaufort, NC Michael J. Field Airport 34-44-01N 076-39-38W 3M | ||
| DAN Danville, VA, Danville Regional Airport, 36-34-22N 079-20 10W 175M | CLT Charlotte, NC NWS Charlotte/Douglas International Airport 35-12-48N 080-56-55W 220M | ||
| IAD Dulles - Washington-Dulles International Airport 38-56-05N 077-26-51W 93M | |||
| FCH Falls Church, VA Erica Page 3/7/94 Windie1970@aol.com | HKY Hickory, NC | ||
| HAM Hampton, VA 5NE Dave Kessel 1989 davidkessel@cox.net |
ECG Elizabeth City, NC, | LYH Lynchburg,
VA NWS Lynchburg Regional Airport 37-19-15N 079-12-24W 295M |
ILM Wilmington,
NC NWS New Hanover International Airport 34-16-06N 077-54-22W 9M |
|
| CTR Winterpock in Chesterfield County, VA Albert Arnold 06/03 | FAY Fayetteville, NC Fayetteville Regional Airport, 34-59-22N 078-52-48W 55M | ||
| GSO Greensboro, NC NWS Piedmont Triad International Airport 36-05-51N 079-56-37W 275M | |||
| CHT Chantilly, VA Russ Topping - 12/2006 russ.topping@gmail.com - new location December 2006 | HSE Cape Hatteras, NC Mitchell Field 35-13-56N 075-27-21W 3M | ||
| HDV Herndon, VA Randoplh W. Ashby, 3.3 SM South, Lat: 38.922127, Lon: -77.38015, Elev: 390'. Randolph_Ashby@Raytheon.com | LBT Lumberton, NC Lumberton Municipal Airport 34-36-26N 079-03-36W 37M | ||
| GAV - Glen Allen, Henrico County, VA - Lowell Koontz 8/1/08 wwkoontz@verizon.net | EWN New Bern, NC Craven County Regional Airport 36-04-03N 077-02-50W 3M | ||
| MON Moncure, NC Chatham County - Mac McIlwain mac.mcilwain@embarqmail.com | |||
| RAL Raleigh, NC 7NNW Bob Woodson - 6/1/93 kf4mmm@qsl.net | |||
| LKU Louisa, VA 1N Joseph Bowers 1944 - NWS ID 44-5050-02 STATION CLOSED | RDU Raleigh-Durham, NC Raleigh-Durham International Airport 35-52-14N 078-47-11W 130M | ||
| LOU Louisa, VA 6S John Bullock (about 1970) STATION CLOSED | ROX Roxboro, NC 2SE Merriell A. Jay 1/93 | ||
| WHI North Whiteville, NC Christopher Crawley 12/10 34.413744N / 078.751908W | |||
| LYH Lynchburg, VA NWS Lynchburg Regional Airport 37-19-15N 079-12-24W 295M | ILM Wilmington, NC NWS New Hanover International Airport 34-16-06N 077-54-22W 9M | ||
| NEW Newmarket, VA 2W Joyce Winfree STATION CLOSED 5/31/10 joywood@shentel.net | CHS Charleston, SC NWS Charleston Air Force Base 32-53-56N 080-02-26W 13M | ||
| NPN Newport News, VA 7N Gary Leonard - 6/91 GaryMLeonard@aol.com | CAE Columbia, SC NWS Columbia Metropolitan Airport 33-56-31N 081-07-05W 73M | ||
| NOR Norfolk, VA 3NE Jim Fentress 6/1/77 | FLO Florence, SC Florence Regional Airport 34-11-16N 079-43-51W 44M | ||
| ORF Norfolk, VA 5NE 36-54-13N 076-11-31W 14M 1871 | GSP Greenville-Spartanburg, SC NWS Greenville-Spartanburg Airport 34-53-02N 082-13-15W 286M | ||
| POR Portsmouth, VA 36.81° North 76.33° West 3S Bill Trotter - 7/1/76 wxr@cox.net | CRE North Myrtle Beach, SC Grand Strand Airport 33-48-42N 078-43-26W 10M | ||
| MEC Mechanicsville, VA Glen Martin 11/19/91 | OGB Orangeburg, SC Orangeburg Municipal Airport 33-27-50N 080-51-13W 59M | ||
| FHC Norfolk, VA Fred Heutte Center 36° 54'N 76° 16'W 01/01/03 fhcgarden@cox.net | AND Anderson, SC | ||
| RIC Richmond, VA Richmond International Airport 37-30-40N 077-19-24W 50M | TRI Tri-cities, TN (Bristol / Johnson / Kingsport), Tri-City Regional Airport 36-28-47N 082-23-56W 474M | ||
| ROA Roanoke, VA Roanoke Regional Airport 37-19-01N 079-58-27W 362M | DAV Davis, WV Dave Lesher canaanwx@canaantv.tv |