
http://members.cox.net/wxr/acon.htm
SUMMARY OF
CLIMATOLOGICAL DATA
MAY 2005
...A COOL MAY 2005 ACROSS THE REGION...
With only a few exceptions in your data, May 2005 was a rather cool month with temperatures
averaging about 3° below normal. Coolest spots - compared to normal - were along the coastal
plains in the three state area likely the result of the seemingly incessant building
of troughs into the Northeastern US south through the Carolinas in the later half of the month.
Temps did try to warm-up early in
the month as the winter troughs gave way to high pressure off the southeast US coast.
Temps climbed to near 90° over much of the area on the 11th and 12th. But,
as noted by
RAH in their weather overview of May (below), later in the month we saw a
return to
the building south of upper troughs with cooler, drier air from Canada the result.
In May '05, a noted mixed-bag regarding precipitation departures. With a
slight increase in
the coverage of thunderstorms across the region, some departures actually
were pushed to excessive levels
with heavy rains associated with more summer-like activity. For many of
our stations,
below normal departures were established particularly in the western areas
of Virginia.
Appears the southeast coastal sections of Virginia enjoyed rainfall above
normal, as did the
coastal areas of North Carolina and South Carolina with Cape Hatteras
recording rainfall of 9.32", 5.5" in excess of the average May rainfall there.
-
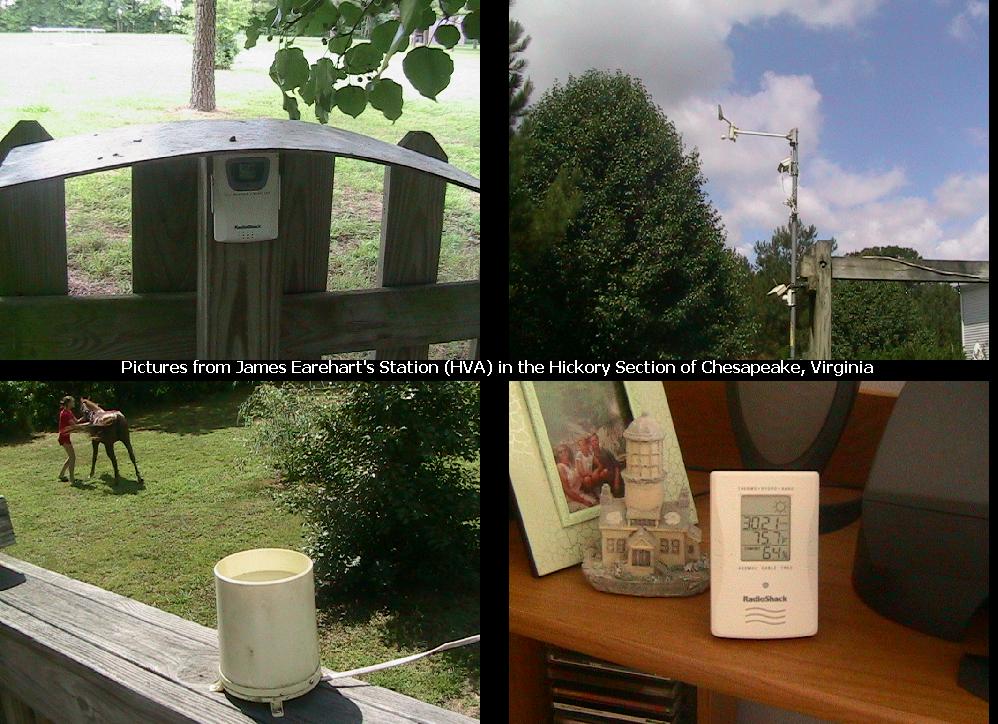
NEW STATION: CHESAPEAKE, VA
We are pleased to add James Earehart to our weather group. Jame's station will be
designated as HVA in
Hickory, Virginia.
James writes: "
Various parts of my weather station are scattered across the yard, so I took
several pictures of the different parts and of my yard as well to give you a
good general idea of the area I live in. I have had my station for a few
years now but have only recently taken an interest in putting it on the
Internet. I am a member of the Weather Underground and I do have my own
webpage that I am still working on right now. The address is
http://www.freewebs.com/hickwx/.
The station is in southern Chesapeake, VA, which is different than the
rest of Hampton Roads because it is a rural area away from the water."
[Editor's note: And also noted for experiencing more lightning strikes than
any other part of Southeastern Virginia!]
-
"PREFERRED THUNDERSTORM PATTERNS
OVER THE DC-BALTIMORE AREA"
Rich Giannola of the JHU/APL
Weather Web Site sends an email
pointing to this interesting analysis by Steve Flood of NCEP and edited by Brian Smith.
Read it online (requires Adobe Acrobat reader) at http://www.jhuapl.edu/weather/education/index.html.
-
WORTH READING
Kevin Shaw is a wonderful resource for articles
about weather and us "weathernuts". He sends along these articles for your
reading pleasure:
->
Observers Keep Tab on Weather Data
->
Co-op Weather Observations - Near real-time data
->
Storm2K Web Site
->
Dirk's Storm Chasing Site
And one which I really like from our member Danny Jessee... (start at his page for Ladysmith, VA and input your own zip code)
->
Your Local Weather (Cable Weather Channel-type display)
-
U.S. DAILY WEATHER MAPS PROJECT
Looking for that NOAA Daily Weather
Map for a given date since 1871? Look no further! Visit the NOAA Central Library
U.S. Daily Weather Maps Project [1871-2001] at http://docs.lib.noaa.gov/rescue/dwm/data_rescue_daily_weather_maps.html.
A link to maps for 2002 to the present is found at the top of the page. Great resource! Note:
You will need to download and install a small program in order to view the
maps.
-
REMINDER
All National Weather Service station data listed
herein is preliminary and may be subject to change. The data has
not been certified and cannot be used in legal actions. Only reports
certified by the National Climatic Data Center in Asheville, NC can
be used for these purposes.
ACON VA/NC/SC Member
Station Extremes - MAY 2005
|
State
|
Maximum Temperature
|
Minimum
Temperature
|
Warmest
Average
Temperature
|
Coldest
Average
Temperature
|
Maximum
Precipitation
|
Minimum
Precipitation
|
|
Virginia
|
90°
Falls Church
|
27°
New Market
|
63.6°
Norfolk (FHC)
|
56.9°
Blacksburg
|
6.03"
Herndon (HRN)
|
1.63"
Blacksburg
|
|
North Carolina
|
91°
Fayetteville, Mebane
|
38°
Asheville
|
67.2°
Fayetteville
|
60.6°
Asheville
|
9.32"
Cape Hatteras
|
1.11"
Fayetteville
|
|
South Carolina
|
90°
Columbia
Charleston
|
42°
Anderson
|
69.9°
Charleston
|
65.5°
Greenville-Spartanburg
|
5.17"
Charleston
|
2.69"
Columbia
|
(Please
note the column denotations table below.)
TEMPERATURE / WINDS/ ELEMENTS
VIRGINIA
[Reminder:
All NWS DATA HEREIN IS NOT OFFICIAL]
     STN  A      B    C     C1    D    E  F     G   H  I  J K K1  L  M     N   N1   N2   O P Q R R1 R2  S    CWA
     -----------------------------------------------------------------------------------------------------------
     ANN 71.65 50.68 61.16 -3.6  87    11 37    3   0  0  0 0 64% 28 WSW   1             1 1 0 0  0     2400 LWX
                                                                  28 NNE  14
     BCB 69.7  44.1  56.9  -2.0  83    12 29    3   0  0  2 0 61% 28 300° 23   4.5       2 0 0 0  1 50% 2400 RNK
     BRI 71.5  47.5  59.5  +2.6  80    29 30    3   0  0  0 0                            3 1      1     2400 LWX
     CEN 70.3  49.7  60.0  -2.0  85    11 34    3   0  0  0 0     32 007°  8             2 0 0 0  0     2400 LWX
     CHO 72.0  48.4  60.2  -5.0  87    11 31    3   0  0  1 0     32 240°  1   4.0       3 0 0 0  4     2400 LWX
                                                                  35 280°
     HVA 71.9  51.7  61.8  -4.7  85    11 40    4   4  0  0 0 67% 33 NE    6   3.3  SSE  4 0 0 0  2     2400 AKQ
     DAN 75.0  49.9  62.5  -3.6  88    12 38  2,7   0  0  0 0 68% 29 050° 20   5.9       5 0 0 0  1 30% 2400 RNK
                                                                  29 010° 23
     DCA 70.9  52.8  61.9  -3.7  84    11 38    3   0  0  0 0 61% 54 270° 14   9.0       1 1 0 0  1 60% 2400 LWX
     IAD 70.8  48.5  59.6  -2.7  87    11 32    3   0  0  1 0     40 260° 14   6.6       3 0 0 0  1     2400 LWX
     FCH 70.2  52.5  61.4        90    11 38    3   1  0  0 0     31      20             1 0 0 0        2400 LWX
     HAM                                                                                                2400 AKQ
     HER 69.7  49.1  59.4  -2.9  85.1  11 35.1  3   0  0  0 0     20    8,20             3 0 0 0        2400 LWX
     HRN 68.8  48.3  58.8  -3.5  85.7  11 31.8  3   3  0  1 0 66% 32 NE   20   2.7  N    0 0 0 0  0     2400 LWX
     LYH 72.7  47.3  60.0  -3.4  87    12 31    3   0  0  2 0 68% 32 330°  7   4.2       2 0 0 0  2 40% 2400 RNK
     NEW 71.22 44.61 57.92 -4.48 86    11 27    3   0  0  4 0 61% 23 NW  1,2  13.06 W    1 0 0 0  0     1800 LWX
     NPN 73.4  52.1  62.8        86    27 41    4   0  0  0 0     29 W     8             4 0 0 0  0     2400 AKQ
     NOR 72.3  52.5  62.4  -5.4  85    27 41    4   0  0  0 0                            3 1 0 0  0     2400 AKQ
     ORF 70.7  54.2  62.5  -3.8  83 14,27 44    4   0  0  0 0 77% 50 040°  6   9.3       4 0 0 0  0 50% 2400 AKQ
     FHC 73.0  54.2  63.6        86.1  27 47.0  4   0  0  0 0 71% 42 243° 15   3.0  022° 1 0 0 0  0     2400 LWX
     POR 72.1  54.2  63.1  -4.4  83    27 44    4   0  0  0 0 68% 47 023°  6   3.89 123° 1 0 0 0  0 48% 2400 AKQ
     CTR 73.8  50.3  62.0  -3.9  87.0  12 37.5  2   2  0  0 0 77% 14 WSW   7   0.1  E    2 0 0 0  0 62% 2400 AKQ
     MEC 74.88 51.31 63.1        86 11,12 38    3   0  0  0 0     11 W     1             3 0 0 0  0     1700 AKQ
     RIC 74.0  52.7  63.4  -2.0  87    11 41  3,5   0  0  0 0 65% 32 010°  8   7.3       3 0 0 0  2 60% 2400 AKQ
     RGL 73.3  50.3  61.8  -4.2  87    11 34    3   0  0  0 0 64% 26 NNE   8   2.0  S    1 0 0 0  0     2400 AKQ
     ROA 73.6  50.8  62.2  +0.6  83    20 31   16   0  0  1 0 59% 55 300°  3   8.3       2 0 0 0  1 50% 2400 RNK
     AKQ 75    51    63.0        86    12 39    5   0  0  0 0                                           2400 AKQ
     WAL 66.9  50.0  58.5  -3.8  81    27 40    5   0  0  0 0     38 060°  6  12.3       0 0 0 0  1     2400 AKQ
     WOO 67.6  50.4  59.0  -3.1  84    12 34    3   0  0  0 0                            3 0 0 0  0     2400 LWX
     WSH 71.3  49.2  60.2  -3.2  86.4  11 36.2  3   0  0  0 0 65% 19 SE   26   0.8  E    4 0 0 0  0     2400 LWX
|
NORTH CAROLINA
[Reminder:
All NWS DATA HEREIN IS NOT OFFICIAL]
     STN  A      B    C     C1    D    E  F     G   H  I  J K K1  L  M     N   N1   N2   O P Q R R1 R2  S    CWA
     -----------------------------------------------------------------------------------------------------------
     AVL 72.4  48.8  60.6  -1.4  86    12 38    2   0  0  0 0     37 320°  1   6.1       5 0 0 0  4     2400 GSP
     MRH 72.7  57.1  64.9        80    29 46    7   0  0  0 0     60 110°  6   9.7       5 0 0 0  1     2400 MHX
     CLT 76.2  53.3  64.7  -4.3  89    12 42    7   0  0  0 0     32 010° 24   5.7       3 0 0 0  1     2400 GSP
     ECG 72.8  53.5  63.2  -4.7  85    28 44    2   0  0  0 0 70% 54 040°  6   9.0       3 0 0 0  3 40% 2400 AKQ
     FAY 79.1  55.3  67.2        91    12 42    7   1  0  0 0 70% 43 330° 24   7.8       2 0 0 0  1 30% 2400 RAH
     GSO 75.0  53.3  64.1  -1.7  88    12 41    2   0  0  0 0 66% 36 360° 23   7.1       5 0 0 0  1 40% 2400 RAH
     HSE 69.8  56.1  63.0  -4.6  78    12 48   22   0  0  0 0     61 350°  6   9.6       0 0 0 0  2     2400 MHX
     HKY 75.4  52.9  64.2  -2.1  88    12 41    3   0  0  0 0     47 350° 19   4.9       6 1 0 0  4     2400 GSP
     LBT 78.9  53.1  66.0  -2.4  90 12,28 39    7   3  0  0 0     41 330° 24   6.3       0 0 0 0  2     2400 ILM
     MNC 75.5  53.0  63.6  -3.1  90.5  12 39.6  7   1  0  0 0     49 WSW  19   0.7  WNW  3 2 0 0  1     2400 RAH
     EWN 75.7  54.6  65.2  -3.7  89    12 45    7   0  0  0 0     41 360°  6   7.5       5 0 0 0  2     2400 MHX
     RAL 76.8  50.5  63.7  -3.3  89    12 40    4   0  0  0 0     20       6   0.9  WSW  2 0 0 0  0     2400 RAH
     RDU 77.1  52.5  64.8  -2.2  89    12 39    7   0  0  0 0 66% 30 210° 20   6.0       4 0 0 0  0 60% 2400 MHX
                                                                  30 360° 24
     ROX 75.1  52.1  63.6  -1.9  89    12 39  2,7   0  0  0 0 68% 26 N     1        N    1 0 0 0  1 47% 2200 RAH
     ILM 76.5  57.1  66.8  -3.4  88 12,28 45    7   0  0  0 0     43 010°  6   8.0       7 0 0 0  4     2400 ILM
|
SOUTH CAROLINA
[Reminder:
All NWS DATA HEREIN IS NOT OFFICIAL]
     STN  A      B    C     C1    D    E  F      G  H  I  J K K1  L  M     N   N1   N2   O P Q R R1 R2  S    CWA
     -----------------------------------------------------------------------------------------------------------
     AND 77.5  54.7  66.1  -2.7  88    23 42     4  0  0  0 0     31 320° 24   5.5       6 0 0 0  6     2400 GSP
     CAE 80.2  56.9  68.5  -3.1  90    12 44     7  1  0  0 0     35 310° 28   6.2       4 0 0 0  3     2400 CAE
     CRE 75.4  58.6  67.0  -3.0  87    23 45     7  0  0  0 0     49 220° 20   7.7       1 0 0 0  5     2400 CHS
     CHS 80.5  59.2  69.9  -2.2  90    23 46     7  0  0  0 0     44 270° 20   7.5       7 0 0 0  6     2400 CHS
     FLO 78.5  56.0  67.2  -3.8  89    12 44   2,7  0  0  0 0     40 310° 15   7.2       3 0 0 0  3     2400 ILM
     GSP 76.7  54.4  65.5  -1.7  88    12 45     2  0  0  0 0     32 350° 24   5.8       6 0 0 0  1     2400 GSP
OGB 80.3 56.3 68.3 89 23,28 44 7 0 0 0 0 32 250° 23 5.6 5 0 0 0 3 2400 CAE |
NEARBY STATIONS
[Reminder:
All NWS DATA HEREIN IS NOT OFFICIAL]
     STN  A      B    C     C1    D    E  F      G  H  I  J K K1  L  M     N   N1   N2   O P Q R R1 R2  S    CWA
     -----------------------------------------------------------------------------------------------------------
     TRI 73.5  48.0  60.7  -2.3  84  9,12  32   3  0  0  1 0     46 260°  13   3.8       6 0 0 0  4     2400 MRX
     DAV 59.1  40.5  49.8        76    11  28   3  0  0  4 0                             6 1 0 0  5     0700 PBZ
25 |
(Please
note the column denotations table below.)
PRECIPITATION / BAROMETRIC PRESSURE
VIRGINIA
[Reminder:
All NWS DATA HEREIN IS NOT OFFICIAL]
STN T T1 U U1 V V1 W X Y Z 1 2 3 4 5 6 6A 7 7A 8 S
-------------------------------------------------------------------------------------------------------
ANN 4.91 2.56 20 2.65 19-20 8 2 19.86 0.0 0.0 21.1 30.53 5 29.57 23, 29.99 2400
BCB 1.63 -2.76 0.74 14 0.74 14 10 0 13.27 0.0 0.0 23.1 24 2400
BRI 3.82 -0.10 2.02 22 2.17 22-23 6 1 12.23 0.0 0.0 11.0 30.42 5 29.59 24 0515/1600
CEN 5.69 +1.21 2.53 20 2.72 19-20 8 2 19.84 0.0 0.0 21.1 30.50 3,5 29.57 23 2400
CHO 2.48 -2.38 0.64 20 1.27 19-20 11 0 15.26 30.50 5 29.51 23 2400
HVA 5.12 -1.38 2.24 6 9 2 19.86 0.0 0.0 9.0 30.45 5 29.55 23 29.97 2400
DAN 2.04 -1.92 0.41 15 0.49 19-20 10 0 10.26 0.0 0.0 4.3 30.45 5 29.52 23 2400
DCA 4.61 +0.79 2.63 20 2.87 19-20 9 2 18.34 0.0 0.0 12.4 30.53 5 29.56 23 2400
IAD 4.86 +0.64 1.86 20 2.21 19-20 11 2 17.68 0.0 0.0 17.3 30.51 5 29.55 23 2400
FCH 5.65 2.45 20 2.45 20 7 2 10.69 0.0 0.0 16.0 2400
HAM 10.3914.0 2400
HER 5.29 +1.07 2.24 20 2.35 19-20 11 3 19.82 0.0 0.0 19.4 2400
HRN 6.03 +1.81 2.52 20 13 2 20.38 0.0 0.0 19.0 30.463 5 29.534 23 29.95 2400
LYH 2.12 -1.99 0.64 20 0.96 19-20 11 0 12.40 0.0 0.0 6.1 30.49 5 29.53 23 2400
NEW 2.65 -1.50 1.65 20 7 1 10.72 0.0 0.0 23 Ľ 30.56 5 29.82 23,24 1700
NPN 4.63 2.11 6 2.13 6-7 11 1 16.73 0.0 0.0 18.5 30.44 5 29.44 23 2400
NOR 5.27 +1.20 1.92 6 1.97 6-7 11 2 16.99 0.0 0.0 7.8 2400
ORF 4.02 +0.28 1.52 6 1.52 6 11 2 13.81 0.0 0.0 8.0 30.49 5 29.50 23 2400
FHC 5.87 2.04 15 12 2 17.75 0.0 0.0 8.0 30.466 5 29.460 23 29.945 2400
POR 4.55 +0.41 1.76 6 1.80 6-7 12 1 15.71 0.0 0.0 8.3 30.482 5 29.493 3 29.974 2400
CTR 2.70 -1.15 0.94 1 0.94 1 12 0 12.40 0.0 0.0 5.3 30.47 5 29.47 23 29.962 2400
MEC 5.29 1.86 31 1.86 31 10 2 11.11 0.0 0.0 10.4 30.24 5 29.48 23 1700
RIC 4.22 +0.26 0.97 20 1.11 19-20 11 0 15.07 0.0 0.0 5.6 30.13 31 29.76 26 2400
RGL 4.12 +0.14 1.69 20 1.92 19-20 9 1 15.61 0.0 0.0 3.7 30.50 5 29.53 23 29.980 2400
ROA 2.16 -2.08 1.57 19 1.66 19-20 9 1 12.86 0.0 0.0 16.1 30.79 5 29.55 23 2400
AKQ 2.89 1.30 6 13 1 15.27 0.0 0.0 9.1 2400
WAL 2.93 -0.27 1.57 20 1.57 20 9 1 15.27 0.0 0.0 9.0 30.53 5 28.54 24 2400
WOO 3.37 -0.86 1.27 23-24 12 1 12.13 0.0 0.0 16.1 30.49 5 29.74 24 0800
WSH 2.67 +1.46 1.35 20 1.90 19-20 11 1 15.04 0.0 0.0 15.1 30.52 5 29.58 23 2400
|
NORTH CAROLINA
[Reminder:
All NWS DATA HEREIN IS NOT OFFICIAL]
STN  T      T1     U  U1   V    V1   W X   Y     Z   1  2 3   4    5     6    6A   7    7A    8     S
---------------------------------------- --------------------------------------------------------------
AVL  1.65  -2.77 0.98 20 1.05 19-20  7 0 12.41  0.0          0.0  6.6  30.38   5 29.61  24         2400
MRH  2.86        1.00  5 1.00     5 10 1 13.73  0.0          0.0    T  30.34   5 29.54  24         2400
CLT  2.42  -1.24 0.79 12 0.84 12-13 10 1 15.30  0.0          0.0    T  30.38   5 29.55  23         2400
ECG  5.53  +1.10 2.18  6 3.18     6 13 1 16.71  0.0          0.0  3.3  30.46   5 29.50  23         2400
FAY  1.11        0.39 20 0.39 19-20  8 0  6.81  0.0          0.0                                   2400
GSO  1.84  -2.11 0.51  1 0.52  30-1 11 0 11.73  0.0          0.0  1.7                              2400
HSE  9.32  +5.40 4.98  6 5.40   5-6 10 3 21.74  0.0          0.0  0.0  30.38   5 29.53  24         2400
HKY  4.36  -0.10 1.41 19 2.74 19-20 10 2 16.54  0.0          0.0  3.0  30.38   5 29.53  23         2400
LBT  1.45  -2.52 0.66 30 0.66    30  8 0  9.35  0.0          0.0  0.0                              2400
MNC  2.87  -1.00         1.09    19  9 1        0.0          0.0  5.0  30.473  5 29.484 23         2400
EWN  5.99  +1.80 2.87  5 3.42   5-6 14 1 17.40  0.0          0.0  1.5  30.10  31 29.54  24         2400
RAL  2.78  -1.01 0.67  6 0.97   5-6 11 0 13.33  0.0          0.0  1.1  30.39   5 29.26  23         1900
RDU  2.07  -1.72 0.52  6 0.82   5-6  8 0 13.43  0.0          0.0  0.2                              2400
ROX  2.54  -1.27 0.82 19 0.82    19  7 0 14.54  0.0          0.0  5.7  30.46   5 29.55  23  30.01  2100
ILM  5.91  +1.51 2.17  6 3.12   5-6 11 1 16.67  0.0          0.0    T                              2400
|
SOUTH CAROLINA
[Reminder:
All NWS DATA HEREIN IS NOT OFFICIAL]
STN  T      T1     U  U1   V    V1   W X   Y     Z   1  2 3  4     5     6    6A   7    7A    8    S
------------------------------------------------------------------------------------------------------
AND  3.45  -0.45 1.52 20 1.57 19-20 10 2 21.26  0.0          0.0  1.0  30.31   5 29.59  24        2400
CAE  2.69  -0.48 1.68 20 1.68    20  9 1 15.77  0.0          0.0    T  30.28   5 29.53  24        2400
CRE  3.65  +0.66 1.09  6 2.00   5-6 10 1 14.28  0.0          0.0    T  30.04  31 29.81  25        2400
CHS  5.17  +1.50 1.18 30 1.18    30 10 2 15.98  0.0          0.0    T                             2400
FLO  2.83  -0.48 0.96 20 1.29 20-21  8 0 13.52  0.0          0.0  0.0  30.32   5 29.53  24        2400
GSP  3.92  -0.67 1.76 20 1.76    20 10 1 17.75  0.0          0.0  1.2  30.34   5 29.56  23        2400
OGB  4.15        1.31 30 1.31    30 11 1 16.93  0.0          0.0    T  30.25   5 29.53  24        2400
|
NEARBY STATIONS
[Reminder:
All NWS DATA HEREIN IS NOT OFFICIAL]
STN  T      T1     U  U1   V      V1   W X   Y     Z   1  2 3  4     5    6   6A   7   7A    8     S
------------------------------------------------------------------------------------------------------
TRI  2.26  -2.06 0.61 20 0.74 19-20  8 0 16.23  0.0           0.0   4.0                           2400
DAV 5.35 1.44 20 14 1 29.02 0.3 3 2 0 0.3 162.1 0700 |
Virginia:
Annandale
- Lowell notes:
"
May was windy and the third coolest and the tenth wettest
in the last 25 years. The mean temperature (61.2°F) was - 3.6° F below
the average; only 1994 and 2003 were cooler in the last 25 years.
May's highest minimum temperature was only 62° F on May 15th which was the
second lowest high monthly minimum every recorded for May. The record was 61°
F in 1994 (No warm nights). The lowest temperature in May was 37° F on the
3rd that tied for the 3rd lowest temperature on record in May in the past
25 years. Both other occasions when the temperature was lower it was only
one degree lower. Also the highest daily mean temperature for May was 71.0
on the 11th which is the lowest on record in the last 25 years. The old
record was 72.5° F in 1992.
The May rainfall had a + 0.61 inch departure and the wettest since 2003.
The 2.56 inches of rain on the 20th was the second greatest daily rain in
May in the past 25 years and the 17th greatest daily rain in the past
25 years. The 24 hour rain total of 2.65 inches was the 15th greatest on
record at Annandale - Barcroft Hills Weather Center. On the 14th 0.32 inches of rain fell in five minutes; only one rain in May since 1991 was more intense. In 1995 0.38 inches occurred in five minutes. Also on the 14th storm one lightning strike hit a tree just 2 houses down giving a popping sound and splitting the bark of the tree.
The maximum gust of 28 mph on the 1st and 14th tied for the 5th
lowest maximum wind gust recorded for May in the last 25 years.
But May's wind run was the highest on record (records since 2002)
since many days had a maximum wind gust in the high teens or low
twenties. The average daily high wind gust was 18.1 mph the
highest on record (records since 1999).
The 17% relative humidity was the lowest recorded in May
since 1997 when 16% was recorded.
The maximum barometer of 30.58 inches on May 5th was the
highest for May since 2001.
There were 8 daily records set!
May DAILY Records Tied or Broken- (25-Years of records):
2 LOW maximum temperature records: 6, 24;
1 LOW minimum temperature record: 3;
2 LOW range temperature records: 13, 24;
3 HIGH precipitation records for the date" 14, 20, 24.
SPRING SEASON-
The mean spring temperature was 53.0°F which was the lowest since 1996
and ranked fourth place from the coolest in the last 25 years. The
total precipitation was 14.05 inches which was the wettest since 2003
and ranked eighth place from being the wettest in the last 25 years.
" [ - + ]
Arlington
- Report from NWS LWX (Strong):
"
THIS YEAR FEATURED A PARTICULARLY COOL MAY. IT WAS THE FIFTH
COOLEST MAY ON RECORD IN BALTIMORE...WHILE IT WAS THE FOURTEENTH
COOLEST MAY FOR WASHINGTON. BOTH CITIES HAVE RECORDS DATING BACK TO
THE EARLY 1870S. THERE WERE NO SEVERE COLD SNAPS OR EXTRAORDINARILY
LATE FREEZES...JUST A CONSISTENT PATTERN OF NEAR TO BELOW NORMAL
TEMPERATURES. MOST DAYS REACHED HIGHS IN THE 60S AND 70S WITH NIGHT
TIME LOWS IN THE 40S AND 50S.
THE MOST UNSEASONABLY COOL WEATHER OF THE MONTH CAME WHEN A COASTAL
STORM GENERATED A NORTHEAST FLOW OFF THE CHILLY NORTH ATLANTIC.
DURING THOSE DAYS ON THE 24TH AND 25TH... TEMPERATURES REMAINED IN
THE 50S ALL DAY AND NIGHT...WHILE A THIRD TO HALF INCH OF RAIN FELL
OVER THE REGION.
RAINFALL WAS A BIT ABOVE NORMAL IN WASHINGTON...WHILE A LITTLE BELOW
NORMAL IN BALTIMORE. THIS DISCREPANCY WAS MAINLY DUE TO A
THUNDERSTORM THAT MOVED OVER WASHINGTON ON THE 14TH LEAVING OVER AN
INCH OF RAIN. STILL...FOR BOTH CITIES...MORE THAN TWO THIRDS OF THE
DAYS IN MAY DID NOT HAVE MEASURABLE RAIN. IT WAS NOT NEARLY AS RAINY
AS THE MAY DURING THE SOGGY SPRING OF 2002. ABOUT SEVEN INCHES OF
RAIN FELL THAT MONTH OVER BOTH WASHINGTON AND BALTIMORE ON NEARLY
TWICE AS MANY DAYS AS THIS MAY.
" [ - + ]
Bridgewater
- "
There was a severe thunderstorm on the 14th. Hail occurred in parts
of Bridgewater and the wind was strong. The rainfall was close to normal,
and the temperature was 2.6 degrees below normal. The first part of the
month was dry with only .48 of precipitation occurring. In the last two
weeks, 3.34 inches of precipitation fell. Garden vegetables were slow in
growing because of the cool temperatures.
" - [ - +/- ]
Centreville
- "
A cool May no matter how you mix the numbers, but nothing much to make
record keepers do much more than to pass a casual glance. Eighty-five
degrees on the 11th for the hottest day of the month managed to stand out
as unusual when compared to our monthly high average temperature of 70.3°
coupled with only two other days that were able to make 80° or better. Our
overall monthly average of 60.0° was two degrees cooler than the 62.0°
reading listed in the tables of highs and lows. After a maximum of just 56°
on the 5th, and the 85° monthly maximum reading five days later, there
wasn't much in the extreme department to write home about. Low temperatures
for May grabbed more headline space this month than just about anything
else. Not because of 34° coming in as the monthly low on the 3rd, or that
there were two other days with daily minimums in the 30's; nope, none of
that. The average low temperature for May 2005 was a bone chilling 0.1°
below the statistical low average of 49.8°.
Several attempts at applying the computer minus key were made before the
"-" would actually take.
With rain and drizzle continuing briefly on the 1st of May from the
previous month, no further precipitation was accounted for until May
14th when 1.43" accumulated in just over two hours. Light rain beginning
during the evening of the 19th continued on the 20th when moderate rates
of rainfall were observed thru 1400. In a little over 15˝ hours, 2.72" of
rain managed to give us a decent soaking. At the final tip in the bucket
for the month, a grand total of 5.69" was recorded. This is a monthly
surplus of 1.21", or 127% over the 4.48" normally expected. At the end of
May we are bragging about an annual surplus of 1.68".
" - [ - + ]
Chesterfield
-
The small creek branch that runs on my property, as
of May 31, the surface of creek is dry. However, with this rain in June,
the creek is flowing but not as much.
- [ - - ]
Falls Church
- "
May 2005 was a cool, wet month. On May 20th I had a new record for
daily rainfall (2.45"). Also that day was my peak wind gust of 31 MPH.
This month seemed to go between feeling like late winter and early spring.
The 11th did bring my first and only 90 degree day so far this year.
" - report from Erica [ - + ]
Herndon
- Russ reports:"
May temperatures were a cool 3.5 degrees below normal and precipitation
was 1.81" above average, after a very dry start to the month. We had 2
thunderstorms on the 14th, and one on the 23rd. Relatively quiet for
May. May was a month for the record books. Maximum rainfall was 2.52"
on the 20th, which set a new daily record. Daily rainfall record was
set on the 14th, with 1.67" of rain and the 24th, with 0.98. A record
minimum temperature of 31.8 degrees was set on the 3rd.
" - [ - + ]
Herndon
- Bob reports:"
My average MAX temperature was 4.9°
BELOW
the Dulles "normal" and the average
MIN was 0.8° BELOW "normal".
A strong thunderstorm on the 14th
killed my modem - and also
the real-time recorder on the
ground-water well at the USGS
in Reston.
" - [ - + ]
Portsmouth
- "
May 2005 station records:
6TH - DAILY PRECIPITATION - 1.76" [PREVIOUSLY 0.83" 1996];
15TH - DAILY PRECIPITATION - 0.78" [PREVIOUSLY 0.43" 1978];
24TH - TEMPERATURE - MINIMUM MAXIMUM - 62° [PREVIOUSLY 63° 1985];
25TH - TEMPERATURE - MINIMUM MAXIMUM - 59° [PREVIOUSLY 70° 1988].
Precipitation was above normal for the month (110%) and temps (-4.4°) were below normal,
a rather chilly May indeed!
- [ - + ]
Ruther Glen
- Danny notes:
"
May was more than 4° cooler than average, and a full 11° cooler than
May 2004, bringing the streak of consecutive months with
below normal temperatures to 3. Precipitation finished slightly
above normal thanks to a 1.92" rain event on the 19th and 20th.
" - [ - + ]
North
Carolina:
Mebane
-
"
Another below average month here in Mebane with a few damaging storms. One,
on the 12th, created <ľ" hail and wind damage to branches. US 70 in between
Mebane and Efland was blocked for a time due to branches in the highway.
The second storm on the 19th caused damage to two buildings sites a few
blocks over in the Mebane downtown district. One roof was blown off and
another had a lightning strike to the air conditioning unit. A railroad
crossing was also damaged.
http://www.aconews.com/articles/2005/05/20/mebane_enterprise/news/news03.txt
" - [ - - ] - notes from Sean
Raleigh
-
"
A cool and relatively dry spring continued thru the month of May. The
average daily temperature for May was 3.3° below normal while rainfall was
1.01" below normal. With this type of weather pattern (almost winter like)
there was very little severe weather in area. During May, only two
thunderstorm days were observed at this station.
" - [ - - ] - notes from Bob Woodson
Raleigh
- NWS Raleigh (RAH) reports:
"
Temperatures during May 2005 returned to above normal levels after a
generally cooler than normal April. A Bermuda high pressure system
(more typical of the middle of the summer season) developed during the
first two weeks of the month, a few weeks earlier than normal. This pattern
brought a few periods of warm temperatures, high humidities, and
thunderstorms. After an unusually cool April, the rapid onset of these
warm and humid conditions was a little hard to take for many North
Carolinian's.
A strong mid and upper level low pressure system developed over the
Great Lakes region on May 14-15 as the Bermuda high weakened. This allowed
a strong cold front to sweep cooler and much drier air into North Carolina
from the northwest on May 14. The third week of the month was dominated
by several upper level troughs that developed over North Carolina or
the adjacent coastal area. The pattern brought unseasonably cool readings
to the state. Temperatures returned to seasonable levels during the last
week of the month.
Rather unsettled and stormy conditions prevailed the first week of May
with the onset of the Bermuda high. This was followed by dry
conditions (especially east of the Mountains) during the second and
third weeks of May as the prevailing flow became dry northwesterly on
the back side of the trough. Many locations over the central Piedmont and
Sandhills did not record any rainfall for two consecutive weeks during
the middle of the month after having received 1 to 3 inches of rain during
the first week. The only exception was over the Mountains where scattered
showers and thunderstorms were able to develop at times on a daily basis.
The full May 2005 NC Weather Review is available at:
http://www.erh.noaa.gov/rah/climate/data/MonthlySummary.May.2005.doc.
"
Wilmington
-
"
RECORD LOW MAX TEMPERATURE SET ON THE 6TH (54°) . PREVIOUS RECORD 57 SET IN 1911.
RECORD RAINFALL SET ON THE 6TH (2.17"). PREVIOUS RECORD WAS 1.21 INCHES SET IN 1958.
" [ - + ] - report from NWS ILM
South
Carolina:
Florence
-
"
RECORD LOW TEMPERATURE TIED ON THE 6TH (45°). RECORD WAS PREVIOUSLY SET IN 1987.
" - [ - - ] - report from NWS ILM
North Myrtle Beach
-
"
RECORD LOW TEMPERATURE SET ON THE 7TH (45°). PREVIOUS RECORD WAS 46 SET IN 1954.
RECORD RAINFALL SET ON THE 24TH (0.56"). PREVIOUS RECORD WAS A TRACE SET IN 2000.
RECORD LOW TEMPERATURE TIED ON THE 26TH (53°). RECORD WAS PREVIOUSLY SET IN 1951.
" [ - + ] - report from NWS ILM
Elsewhere:
Davis, WV
-
Dave Lesher sends along this website to check weather in his vicinity.
"Jon and Cindy Robeson have set up on-line weather
instruments outside their home in Davis, WV...they're the
owner/operators of Meyer House B&B in Davis. Check their
site for the latest weather obs there:
http://www.meyerhousebandb.com/Current_Vantage_Pro.htm - Dave
"
Tri-Cities
-
"
The monthly average temperature at Tri-Cities was 60.7°, which was 2.3°
below normal. It tied with 1973 as the 7th coldest May on record
at Tri-Cities. A record low was broken on the 3rd, when the overnight low
dipped to 32°, breaking the previous record of 34° set in 1978. In addition,
a daily record low was tied on the 29th, when the low temperature fell to 44°,
tying the previous record set in 1949. The coldest May at Tri-Cities was
back in 1997, when the average temperature was 58.3°.
Tri-Cities received only 2.26 inches of rain in May, which was 2.06 inches
below normal. It ranked as the 15th driest May on record at Tri-Cities.
Measurable precipitation occurred on only eight days, and only three of t
those days had more than one-half of an inch of rain. The heaviest rain
fell on the 20th, when 0.61 inches of rain was reported. The driest May at
Tri-Cities was back in 1939, when only 0.95 inches was recorded.
The seasonal average temperature at Tri-Cities was 53.5°, which was 1.2°
below normal. It ranked as the 10th coldest spring on record at Tri-Cities.
One record high was broken in April, while a record low was tied later that
month; two more record lows were tied/broken in May. The coldest spring at
Tri-Cities was back in 1960, when the average temperature was 51.8°.
Tri-Cities received 10.55 inches of rain this spring, which was 0.91 inches
below normal. It tied with 1948 as the 30th driest spring on record at
Tri-Cities. Above normal rainfall occurred in April, including two new
daily rainfall records, but the below normal rainfall in March and May,
resulted in the deficit for the entire season. The driest spring at
Tri-Cities was back in 1986, when only 6.23 inches was recorded.
" - [ - - ] - report from NWS MRX
COLUMN
DENOTATIONS:
| A maximum mean temperature |
T total precipitation (inches)
T1 departure from normal |
| B minimum mean temperature |
U maximum calendar day precipitation
(inches) |
C monthly mean temperature
C1 departure from normal |
U1 date of maximum calendar day precipitation |
| D maximum temperature |
V date(s) of maximum daily precipitation |
| E date(s) of maximum temperature |
V1 maximum 24-hour precip. &
date(s) |
| F minimum temperature |
W number of days with precip. >=
.01" |
| G date(s) of minimum temperature |
X number of days with precip. >=
1.0" |
| H days with maximum temperature
>=90 |
Y year-to-date precipitation (inches) |
| I days with maximum temperature
<=32 |
Z maximum calendar day snowfall (inches) |
| J days with minimum temperature
<=32 |
|
| K days with minimum temperature
<= 0 |
1 date of maximum calendar day snowfall (inches)
|
| K1 average relative humidity |
2 number of days with snowfall |
| L peak wind gust (miles per
hour) |
3 number of days with snowfall >=
1.0" |
| M direction of peak wind gust |
4 total snowfall for month
(inches) |
| N date(s) of peak wind gust |
5 total snowfall for 2004-2005 season
(inches) |
| N1 average wind speed (miles per hour) |
6 maximum barometric pressure (inches) |
| N2 dominant wind direction |
6A date of maximum barometric pressure |
| O number of days with thunder |
7 minimum barometric pressure (inches) |
| P number of days with hail |
7A date of minimum barometric pressure |
| Q number of days with glaze |
8 average sea-level pressure |
| R number of days with ice pellets |
|
| R2 sky cover percentage |
NR not recorded |
| R1 number of days with dense fog
[1/4 mile and less visibility] |
(i) incomplete data |
| S local observation time for
temps/precipitation |
(M) missing, if listed in data table |
| ~ "about" |
E estimated |
| + additional indeterminate
number of days |
CWA - NWS Office County Warning Area |

For ACON
VA/NC/SC Recent Weather News, Search CNN
http://www.cnn.com/WEATHER
National
Weather Service Web Sites & Current Email Addresses
Within or
Nearby the ACON VA/NC/SC Area Can Be Found At:
NWS Washington/Baltimore,
VA/MD
NWS Wakefield, VA
NWS Blacksburg, VA
NWS Raleigh, NC
NWS Newport/Morehead City, NC
NWS Wilmington, NC
NWS Greenville-Spartanburg, SC
NWS Columbia, SC
NWS Charleston, SC
NWS Morristown, TN
National Weather Service
Homepages
$$$ National Climatic Data
Center, Asheville, NC $$$
STATION
/ LOCATION (MILES & DIRECTION FROM MAIN POST OFFICE)/OBSERVER / YEAR
RECORDS BEGAN / EMAIL ADDRESS:
| |
ROK Roanoke, VA 6SW Wendell
Prillaman 4/76 wlprillaman@cox.net |
| ANN Annandale,
VA 1 3/4 ENE - Lowell Koontz 8/31/79 wwkoontz@verizon.net |
AKQ Wakefield,
VA NWS Wakefield Municipal Airport 36-58-53N 077-00-04W 33M |
| DCA Arlington,
VA Washington, DC, Reagan Washington National Airport 38-50-54N 077-02-03W
18M |
WSH Washington, VA
David Yowell runamok@runamok.com |
| BCB Blacksburg,
VA NWS Virginia Tech Airport 37-13N 080-25W |
WEE Weems, VA 3WNW Francis
J. Socey |
| BRI Bridgewater,
VA Clayton Towers Ctowers@rica.net |
WOO Woodstock, VA 5NW Lauck
Walton - 12/1/85 jwalton@shentel.net |
|
CEN Centreville, VA Paul Bassett 1985, 38° 50.9788' N LAT. 77° 25.6374' W LON. | Elevation 324' | m.psb@verizon.net
|
RGL Ruther Glen, VA 38°0'45" N 77°32'29" W Danny Jessee 2003 danny@dannyjessee.com
|
|
|
WAL Wallops Island, VA
37° 56'26" N
75° 27'47" W Wallops Flight Facility Airport
|
| CHO Charlottesville,
VA Charlottesville-Albemarle Airport ASOS (Rappahannock County)
38-08-18N 078-27-21W 192M |
AVL Asheville,
NC Asheville Regional Airport 35-25-55N 082-32-15W 670M |
| HVA Chesapeake,
VA Hickory, James Earehart, 5/1/2005, kearehart@cox.net |
MRH Beaufort,
NC Michael J. Field Airport 34-44-01N 076-39-38W 3M |
| DAN Danville, VA, Danville
Regional Airport, 36-34-22N 079-20-10W 175M |
BRE Brevard, NC
1SE Bob Keehn 1/1/90 rkeehn@brinet.com |
| IAD Dulles - Washington-Dulles
International Airport 38-56-05N 077-26-51W 93M |
CLT Charlotte,
NC NWS Charlotte/Douglas International Airpot 35-12-48N 080-56-55W 220M |
| FCH Falls Church,
VA Erica Page - 3/7/94 Windie1970@aol.com |
HKY Hickory, NC |
| HAM Hampton, VA
5NE Dave Kessel 1989 davidkessel@cox.net |
ECG Elizabeth City, NC,
Coast Guard Air Station 36-15-47N 076-10-58W 11M |
| CTR Winterpock in Chesterfield County, VA Albert Arnold 06/03 |
FAY Fayetteville, NC Fayetteville
Regional Airport, 34-59-22N 078-52-48W 55M |
| HER Herndon, VA
R.M. Beall P- 10/76 T- 1/91 beall47@earthlink.net |
GSO Greensboro, NC NWS
Piedmont Triad International Airport 36-05-51N 079-56-37W 275M |
| HRN Herndon, VA 4SW Russ
Topping - 1985 weatherwatcher@cox.net |
HSE Cape Hatteras,
NC Mitchell Field 35-13-56N 075-27-21W 3M |
| |
MNC Mebane,
NC Sean McManus 2005 - micman2b@pipeline.com |
| |
LBT Lumberton,
NC Lumberton Municipal Airport 34-36-26N 079-03-36W 37M |
| |
EWN New Bern,
NC Craven County Regional Airport 36-04-03N 077-02-50W 3M |
| LXI Lexington,
VA Scott M. Lancey, WREL Radio - 06/96 weather@wrel.com |
RAL Raleigh, NC
7NNW Bob Woodson - 6/1/93 kf4mmm@qsl.net |
| LKU Louisa,
VA 1N Joseph Bowers 1944 - NWS ID 44-5050-02jmbiii@earthlink.net |
RDU Raleigh-Durham, NC
Raleigh-Durham International Airport 35-52-14N 078-47-11W 130M |
| LOU Louisa,
VA 6S John Bullock (about 1970) INACTIVE 1/1/02 - MEMBER DECEASED FALL 2004 |
ROX Roxboro, NC
2SE Merriell A. Jay 1/93 |
| LYH Lynchburg,
VA NWS Lynchburg Regional Airport 37-19-15N 079-12-24W 295M |
ILM Wilmington,
NC NWS New Hanover International Airport 34-16-06N 077-54-22W 9M |
| NEW Newmarket,
VA 2W Joyce Winfree joywood@shentel.net |
CHS Charleston, SC NWS
Charleston Air Force Base 32-53-56N 080-02-26W 13M |
| NPN Newport
News, VA 7N Gary Leonard - 6/91 GaryMLeonard@aol.com |
CAE Columbia, SC
NWS Columbia Metropolitan Airport 33-56-31N 081-07-05W 73M |
| NOR Norfolk,
VA 3NE Jim Fentress 6/1/77 |
FLO Florence, SC
Florence Regional Airport 34-11-16N 079-43-51W 44M |
| ORF Norfolk,
VA 5NE 36-54-13N 076-11-31W 14M 1871 |
GSP Greenville-Spartanburg,
SC NWS Greenville-Spartanburg Airport 34-53-02N 082-13-15W 286M |
| POR Portsmouth,
VA 36.81° North 76.33° West 3S Bill Trotter - 7/1/76 wxr@cox.net |
CRE North Myrtle
Beach, SC Grand Strand Airport 33-48-42N 078-43-26W 10M |
| MEC Mechanicsville,
VA Glen Martin 11/19/91 |
OGB Orangeburg, SC
Orangeburg Municipal Airport 33-27-50N 080-51-13W 59M |
| FHC Norfolk, VA Fred
Heutte Center 36° 54'N 76° 16'W 01/01/03 fhcgarden@cox.net |
AND Anderson, SC |
| RIC Richmond,
VA Richmond International Airport 37-30-40N 077-19-24W 50M |
TRI Tri-cities,
TN (Bristol / Johnson / Kingsport), Tri-City Regional Airport 36-28-47N
082-23-56W 474M |
| ROA Roanoke, VA
Roanoke Regional Airport 37-19-01N 079-58-27W 362M |
DAV Davis, WV Dave Lesher canaanwx@canaantv.tv |
|