
http://www.genserva.com/acon
SUMMARY OF CLIMATOLOGICAL DATA
SUMMARY OF CLIMATOLOGICAL DATA
EXCELLENT FIRE WEATHER RESOURCES: INFORMATION AND OUTLOOKS From CoCoRaHS..."Another zero in the rain gauge? Hot, dry weather during the late spring and summer can create ideal conditions for wildfires in many parts of the country. As you read this message several wildfires are burning throughout the western United States: ACTIVE FIRES. http://activefiremaps.fs.fed.us. Most NWS Weather Forecast Offices provide fire forecasts twice a day and provide warnings in close partnership with local, state and federal fire control agencies. Learn more about Fire Weather http://www.noaawatch.gov/themes/fire.php and the NOAA Storm Prediction Center's latest Fire Weather Outlooks http://www.spc.noaa.gov/products/fire_wx/ for your part of the county by clicking on the underlined text. The Incident Information System Website http://www.inciweb.org/ is another great resource for finding out where wildfires are currently burning. This site gives a vast amount of information that many of you will find very informative. For additional info on wildfire prevention and other wildfire topics, visit the National Interagency Fire Center’s web site by clicking here: NIFC http://www.nifc.gov/ Want to learn more about Fire Weather? View the CoCoRaHS WxTalk Webinar presented by Liz Page of UCAR/COMET last July. You can do so by clicking here: WILDFIRE http://youtu.be/zKrr-Xw8pcg "
NEW MONTHLY NWS WAKEFIELD (KAKQ) PRODUCT "The CoCoRaHS Team here at NWS Wakefield have created a new feature for our wonderful volunteers. This new feature is a monthly rainfall (sometimes snow!) summary that will show you in text and map form how your daily observations make a difference. The month of April had a very good and complete data set that combined well with other automated observations across the region. Thank you to ALL of YOU that made this possible!!! Here is the April CoCoRaHS climate summary in Adobe .pdf format to view at your leisure. Click here: http://genserva.com/acon/NWSAKQ_April2013_CoCoRaHS_Summary.pdf
Thanks again for all that you do! Your data and efforts really do matter.
Sincerely,
Bridget De Rosa & the CoCoRaHS Team" | bridget.derosa@noaa.gov
DROUGHT MONITOR http://droughtmonitor.unl.edu/ More information on drought can be found at NOAA's Drought Information Center http://www.drought.noaa.gov/
REMINDER All National Weather Service station data listed herein is preliminary and may be subject to change. The data has not been certified and cannot be used in legal actions. Only reports certified by the National Climatic Data Center in Asheville, NC can be used for these purposes.
|
|
|
Temperature |
Average Temperature |
Average Temperature |
Precipitation |
Precipitation |
|
|
Chantilly |
Blacksburg |
Portsmouth |
Blacksburg |
Woodstock |
Wallops Island |
|
|
Lumberton New Bern Wilmington |
Asheville Roxboro |
New Bern |
Asheville |
Asheville |
Elizabeth City |
|
|
Columbia |
Anderson Greenville-Spartanburg |
Charleston |
Greenville-Spartanburg |
Greenville-Spartanburg |
North Myrtle Beach |
| A | B | C | C1 | D | E | F | G | H | I | J | K | K1 | L | M | N | N1 | N2 | O | P | Q | R | R1 | CWA | TIME RECORDED | ||
| BCB | 70.00 | 48.30 | 59.10 | -0.20 | 85.0 | 15 | 31.00 | 14 | 0 | 0 | 1 | 0 | 77% | 33 | 320 | 24 | 5.5 | 5 | 0 | 0 | 0 | 7 | LWX | 2400 | ||
| BRI | 74.10 | 51.70 | 62.90 | 0.00 | 91.0 | 30 | 32.00 | 14 | 1 | 0 | 1 | 0 | 63% | 0 | 0 | 0 | 0 | 1 | LWX | 2400 | ||||||
| CHT | 75.80 | 53.80 | 64.80 | 1.60 | 92.7 | 30 | 35.00 | 14 | 3 | 0 | 3 | 0 | 73% | 18 | 158 | 31 | 0.5 | 180 | 5 | 0 | 0 | 0 | 0 | LWX | 2400 | |
| CHO | 74.30 | 52.40 | 63.30 | 0.10 | 89.0 | 30 | 33.00 | 14 | 0 | 0 | 0 | 0 | 39 | 340 | 24 | 5.8 | 2 | 0 | 0 | 0 | 0 | 3 | LWX | 2400 | ||
| DAN | 75.90 | 54.00 | 65.00 | -1.40 | 89.0 | 15 | 36.00 | 14 | 0 | 0 | 0 | 0 | 70% | 37 | 310 | 24 | 5.5 | 8 | 0 | 0 | 0 | 3 | RNK | 2400 | ||
| DCA | 75.80 | 57.50 | 66.70 | 0.70 | 91.0 | 31 | 42.00 | 14 | 0 | 0 | 3 | 0 | 63% | 38 | 320 | 24 | 8.7 | 5 | 0 | 0 | 0 | 0 | LWX | 2400 | ||
| IAD | 74.40 | 52.50 | 63.50 | 0.30 | 90.0 | 30 | 32.00 | 14 | 1 | 0 | 1 | 0 | 67% | 39 | 330 | 24 | 6.9 | 6 | 0 | 0 | 0 | 2 | LWX | 2400 | ||
| GAV | 76.61 | 54.84 | 65.73 | -3.38 | 89.0 | 30,31 | 36.00 | 14 | 0 | 0 | 0 | 0 | 69% | 28 | 180 | 15 | 5 | 1 | 0 | 0 | 2 | AKQ | 2400 | |||
| HAM | 74.00 | 58.00 | 66.00 | -0.20 | 88.0 | 31 | 43.00 | 14 | 0 | 0 | 0 | 0 | 50% | 40 | 315 | 16 | 10.0 | 180 | 4 | 0 | 0 | 0 | 1 | AKQ | 2400 | |
| HDV | 74.20 | 52.40 | 63.30 | -1.00 | 90.0 | 30 | 34.00 | 14 | 1 | 0 | 3 | 0 | 73% | 19 | 270 | 15 | 225 | 6 | 0 | 0 | 0 | 0 | LWX | 2400 | ||
| LYH | 74.50 | 51.40 | 63.00 | -0.10 | 89.0 | 15 | 34.00 | 14 | 0 | 0 | 0 | 0 | 72% | 38 | 010 | 6 | 5.7 | 7 | 0 | 0 | 0 | 5 | RNK | 2400 | ||
| NPN | 76.20 | 56.90 | 65.90 | -1.10 | 90.1 | 16 | 39.70 | 14 | 2 | 0 | 0 | 0 | 43 | 270 | 16 | 2.2 | 225 | 5 | 0 | 0 | 0 | 0 | AKQ | 2400 | ||
| FHC | 76.03 | 59.37 | 67.70 | 1.10 | 91.0 | 16,31 | 47.50 | 25 | 2 | 0 | 0 | 0 | 69% | 31 | 225 | 11 | 2.0 | 202 | 3 | 0 | 0 | 0 | 0 | AKQ | 2400 | |
| NOR | 75.4 | 57.5 | 66.6 | -1.2 | 89 | 16,31 | 42 | 14 | 0 | 0 | 0 | 0 | 0 | 0 | 0 | 0 | 0 | AKQ | 2400 | |||||||
| ORF | 75.70 | 59.50 | 67.60 | 1.00 | 91.0 | 16 | 45.00 | 14 | 0 | 0 | 0 | 0 | 66% | 35 | 060,340 | 3,24 | 10.1 | 0 | 0 | 0 | 0 | 1 | AKQ | 2400 | ||
| POR | 78.00 | 58.00 | 68.00 | 0.30 | 91 | 16,31 | 43.00 | 14 | 3 | 0 | 0 | 0 | 69% | 30 | 045,045,203,315 | 1,5,15,25 | 4.4 | 018 | 3 | 0 | 0 | 0 | 0 | AKQ | 2400 | |
| CTR | 76.70 | 53.50 | 65.00 | -0.40 | 89.0 | 31 | 33.00 | 14 | 0 | 0 | 0 | 0 | 77% | 19 | 090 | 1 | 0.4 | 090 | 3 | 0 | 0 | 0 | 0 | AKQ | 2400 | |
| MEC | 73.92 | 54.71 | 65.67 | 92 | 31 | 37 | 14 | 2 | 0 | 0 | 0 | 5 | 0 | 0 | 0 | 0 | AKQ | 2400 | ||||||||
| RIC | 77.50 | 55.90 | 66.70 | 0.30 | 92.0 | 31 | 41.00 | 13,14 | 4 | 0 | 0 | 0 | 67% | 46 | 300 | 16 | 8.0 | 4 | 0 | 0 | 0 | 0 | AKQ | 2400 | ||
| ROA | 74.40 | 54.50 | 64.40 | -0.20 | 91.0 | 15 | 35.00 | 14 | 1 | 0 | 0 | 0 | 64% | 55 | 260 | 10 | 6.4 | 7 | 0 | 0 | 0 | 1 | RNK | 2400 | ||
| WAL | 73.00 | 57.00 | 65.00 | 2.30 | 89.0 | 16 | 41.00 | 14 | 0 | 0 | 0 | 0 | 36 | 090 | 3 | 11.4 | 0 | 0 | 0 | 0 | 0 | AKQ | 2400 | |||
| WOO | 69.60 | 51.70 | 60.70 | -1.50 | 86.0 | 23 | 37.00 | 14 | 0 | 0 | 0 | 0 | 2 | 0 | 0 | 0 | 2 | LWX | 0800 | |||||||
| WSH | 72.50 | 52.10 | 62.30 | -1.36 | 89.2 | 31 | 36.50 | 14 | 0 | 0 | 0 | 0 | 76% | 16 | 045 | 13 | 0.5 | 225 | 7 | 0 | 0 | 0 | 0 | LWX | 2400 | |
| Averages | 74.72 | 54.67 | 64.73 | -0.20 | 89.74 | 37.64 | 0.87 | 0.00 | 0.52 | 0.00 | 69% | 33.7 | 5.5 | 3.9 | 0.0 | 0.0 | 0.0 | 1.2 | ||||||||
| STN | A | B | C | C1 | D | E | F | G | H | I | J | K | K1 | L | M | N | N1 | N2 | O | P | Q | R | R1 | CWA | TIME RECORDED | |
| STN | A | B | C | C1 | D | E | F | G | H | I | J | K | K1 | L | M | N | N1 | N2 | O | P | Q | R | R1 | CWA | TIME RECORDED | |
| AVL | 71.9 | 51.7 | 61.8 | -1.30 | 85.0 | 15 | 36.0 | 14 | 0 | 0 | 0 | 0 | 72% | 40 | 330 | 24 | 5.2 | 1 | 0 | 0 | 0 | 6 | GSP | 2400 | ||
| MRH | 75.9 | 61.9 | 68.9 | 0.10 | 82.0 | 30,31 | 50.0 | 14,25 | 0 | 0 | 0 | 0 | 71 | 150 | 6 | 9.3 | 1 | 0 | 0 | 0 | 0 | MHX | 2400 | |||
| CLT | 77.0 | 55.9 | 66.5 | -0.90 | 87.0 | 15,31 | 41.0 | 14,25 | 0 | 0 | 0 | 0 | 70% | 33 | 110 | 5 | 6.8 | 4 | 0 | 0 | 0 | 0 | GSP | 2400 | ||
| ECG | 76.9 | 57.8 | 67.4 | 0.60 | 90.0 | 16 | 41.0 | 14 | 1 | 0 | 0 | 0 | 72% | 38 | 320 | 24 | 10.3 | 1 | 0 | 0 | 0 | 0 | AKQ | 2400 | ||
| FAY | 76.1 | 56.3 | 66.2 | -1.80 | 87.0 | 31 | 44.0 | 14 | 0 | 0 | 0 | 0 | 66% | 31 | 310 | 24 | 6.6 | 8 | 0 | 0 | 0 | 1 | RAH | 2400 | ||
| GSO | 74.9 | 55.8 | 65.3 | -1.50 | 87.0 | 15,21 | 40.0 | 14 | 0 | 0 | 0 | 0 | 35 | 270 | 7 | 8.0 | 5 | 0 | 0 | 0 | 1 | RAH | 2400 | |||
| HSE | 75.5 | 62.2 | 68.9 | 1.80 | 84.0 | 31 | 51.0 | 27 | 0 | 0 | 0 | 0 | 73% | 38 | 050 | 3 | 8.4 | 1 | 0 | 0 | 0 | 2 | MHX | 2400 | ||
| HKY | 75.0 | 54.5 | 64.8 | -1.50 | 89.0 | 15 | 40.0 | 14 | 0 | 0 | 0 | 0 | 38 | 070,330 | 6,24 | 4.9 | 4 | 0 | 0 | 0 | 4 | GSP | 2400 | |||
| LBT | 81.1 | 55.6 | 68.4 | -1.40 | 91.0 | 30,31 | 39.0 | 14 | 4 | 0 | 0 | 0 | 71% | 31 | 280 | 23 | 5.6 | 0 | 0 | 0 | 0 | 10 | ILM | 2400 | ||
| EWN | 80.6 | 59.2 | 69.9 | 0.40 | 91.0 | 16 | 45.0 | 14 | 1 | 0 | 0 | 0 | 67% | 37 | 230 | 11 | 7.1 | 4 | 0 | 0 | 0 | 5 | MHX | 2400 | ||
| RDU | 76.1 | 56.3 | 66.2 | -1.80 | 87.0 | 31 | 39.0 | 14 | 0 | 0 | 0 | 0 | 71% | 31 | 310 | 24 | 6.6 | 7 | 0 | 0 | 0 | 1 | RAH | 2400 | ||
| RAL | 76.6 | 55.3 | 64.2 | -2.00 | 88.0 | 17,31 | 38.0 | 14 | 0 | 0 | 0 | 0 | 21 | 24 | 3 | 0 | 0 | 0 | 0 | RAH | 2400 | |||||
| ROX | 74.6 | 54.8 | 64.9 | -0.6 | 87 | 15,30 | 36 | 14 | 0 | 0 | 0 | 0 | 74% | 34 | 320 | 24 | 180 | 2 | 0 | 0 | 0 | 1 | RAH | 2400 | ||
| WHI | ILM | 2400 | ||||||||||||||||||||||||
| ILM | 78.9 | 59.0 | 68.9 | -1.50 | 91.0 | 16 | 46.0 | 14 | 2 | 0 | 0 | 0 | 70% | 33 | 070 | 3 | 7.9 | 1 | 0 | 0 | 0 | 1 | ILM | 2400 | ||
| Averages | 76.5 | 56.9 | 66.6 | -0.8 | 87.6 | 41.9 | 0.6 | 0.0 | 0.0 | 0.0 | 71% | 36.5 | 7.2 | 3.0 | 0.0 | 0.0 | 0.0 | 2.3 | ||||||||
| STN | A | B | C | C1 | D | E | F | G | H | I | J | K | K1 | L | M | N | N1 | N2 | O | P | Q | R | R1 | CWA | TIME RECORDED | |
| STN | A | B | C | C1 | D | E | F | G | H | I | J | K | K1 | L | M | N | N1 | N2 | O | P | Q | R | R1 | CWA | TIME RECORDED | |
| AND | 77.0 | 56.5 | 66.8 | -1.8 | 88 | 15,21 | 41 | 13,14 | 0 | 0 | 0 | 0 | 45 | 310 | 22 | 6.0 | 3 | 0 | 0 | 0 | 2 | GSP | 2400 | |||
| CAE | 81.4 | 59.2 | 70.3 | -1.4 | 93 | 15 | 44 | 14 | 1 | 0 | 0 | 0 | 65% | 33 | 100 | 19 | 6.0 | 2 | 0 | 0 | 0 | 3 | CAE | 2400 | ||
| CRE | 76.7 | 60.5 | 68.6 | -1.1 | 89 | 16 | 45 | 14 | 0 | 0 | 0 | 0 | 33 | 220 | 15 | 8.3 | 2 | 0 | 0 | 0 | 0 | ILM | 2400 | |||
| CHS | 81.5 | 61.9 | 71.7 | -0.8 | 88 | 17,23 | 49 | 14 | 0 | 0 | 0 | 0 | 38 | 080 | 3 | 8.1 | 2 | 0 | 0 | 0 | 1 | CHS | 2400 | |||
| FLO | 80.5 | 58.5 | 69.5 | -1.6 | 90 | 17 | 44 | 25 | 1 | 0 | 0 | 0 | 68% | 32 | 080,350 | 5,24 | 6.6 | 1 | 0 | 0 | 0 | 4 | ILM | 2400 | ||
| GSP | 76.5 | 56.1 | 66.3 | -2.4 | 88 | 15,21 | 41 | 14 | 0 | 0 | 0 | 0 | 71% | 47 | 210 | 22 | 6.1 | 3 | 0 | 0 | 0 | 3 | GSP | 2400 | ||
| OGB | 80.4 | 58.5 | 69.5 | -2.1 | 89 | 15 | 46 | 14 | 0 | 0 | 0 | 0 | 29 | 080,320 | 5,24 | 5.3 | 0 | 0 | 0 | 0 | 2 | CAE | 2400 | |||
| Averages | 79.1 | 58.7 | 69.0 | -1.6 | 89.3 | 44.3 | 0.3 | 0.0 | 0.0 | 0.0 | 68% | 36.7 | 6.6 | 1.9 | 0.0 | 0.0 | 0.0 | 2.1 | ||||||||
| STN | A | B | C | C1 | D | E | F | G | H | I | J | K | K1 | L | M | N | N1 | N2 | O | P | Q | R | R1 | CWA | TIME RECORDED | |
| STN | A | B | C | C1 | D | E | F | G | H | I | J | K | K1 | L | M | N | N1 | N2 | O | P | Q | R | R1 | CWA | TIME RECORDED | |
| TRI | 74.8 | 51.5 | 63.2 | -0.3 | 87 | 30,31 | 35 | 13,14 | 0 | 0 | 0 | 0 | 36 | 210 | 17 | 4.6 | 8 | 0 | 0 | 0 | 7 | MRX | 2400 | |||
| DAV | 62.9 | 43.8 | 53.3 | 79 | 22 | 25 | 14 | 0 | 0 | 5 | 0 | PBX | 2400 | |||||||||||||
| STN | T | T1 | U | U1 | V | V1 | W | X | Y | Z | 1 | 2 | 3 | 4 | 5 | 6 | 6A | 7 | 7A | 8 | CWA | TIME RECORDED | ||||
| BCB | 5.83 | 1.50 | 1.25 | 6 | 0.99 | 1.25 | 6 | 0 | 21.87 | 0.0 | 27.4 | RNK | 2400 | |||||||||||||
| BRI | 2.90 | -1.05 | 0.98 | 7 | 1.82 | 6-7 | 9 | 0 | 13.04 | 0.0 | 22.0 | 30.410 | 2 | 29.900 | 12 | 30.130 | LWX | 2400 | ||||||||
| CHT | 3.92 | -0.63 | 1.24 | 7 | 1.25 | 7-8 | 13 | 1 | 15.06 | 0.0 | 9.5 | 30.438 | 2 | 29.664 | 15 | 30.057 | LWX | 2400 | ||||||||
| CHO | 4.35 | 0.37 | 1.58 | 7 | 1.64 | 6-7 | 12 | 2 | 16.63 | 30.410 | 2 | 29.710 | 11 | LWX | 2400 | |||||||||||
| DAN | 4.81 | 0.93 | 1.58 | 6 | 1.62 | 6-7 | 10 | 2 | 20.21 | 0.0 | 1.7 | 30.350 | 2 | 29.740 | 11 | RNK | 2400 | |||||||||
| DCA | 2.82 | -1.17 | 1.34 | 28 | 1.34 | 28 | 11 | 1 | 12.58 | 0.0 | 2.6 | 30.460 | 2 | 29.680 | 15 | LWX | 2400 | |||||||||
| IAD | 3.20 | -1.35 | 1.02 | 7 | 1.02 | 7 | 10 | 1 | 11.69 | 0.0 | 10.5 | 30.450 | 2 | 29.680 | 15 | LWX | 2400 | |||||||||
| HAM | 3.04 | -0.59 | 0.83 | 18 | 1.25 | 18-19 | 17 | 0 | 14.39 | 0.0 | 3.0 | 30.400 | 1,2 | 29.750 | 12 | 30.090 | AKQ | 2400 | ||||||||
| GAV | 4.85 | 2.39 | 7 | 2.43 | 6-7 | 12 | 1 | 20.91 | 0.0 | 14.2 | 30.400 | 2 | 29.740 | 11 | 30.070 | AKQ | 2400 | |||||||||
| HDV | 3.49 | -1.33 | 1.20 | 7 | 14 | 1 | 15.34 | 0.0 | 12.1 | 30.420 | 2 | 29.650 | 15 | AKQ | 2400 | |||||||||||
| LYH | 6.12 | 2.39 | 1.82 | 6 | 2.35 | 6-7 | 11 | 2 | 20.44 | 0.0 | 13.0 | 30.380 | 2 | 29.750 | 11 | RNK | 2400 | |||||||||
| NPN | 4.07 | -0.15 | 1.07 | 18 | 1.07 | 18 | 10 | 1 | 22.38 | 0.0 | 5.9 | 30.390 | 2 | 29.730 | 12 | AKQ | 2400 | |||||||||
| FHC | 4.89 | 1.48 | 2.49 | 18 | 2.49 | 18 | 11 | 1 | 17.34 | 0.0 | 1.2 | 30.397 | 2 | 29.758 | 12 | 30.090 | AKQ | 2400 | ||||||||
| NOR | 4.04 | -0.03 | 1.59 | 18 | 1.59 | 18 | 13 | 1 | 18.32 | 0.0 | 1.8 | AKQ | 2400 | |||||||||||||
| ORF | 4.15 | 0.74 | 1.71 | 18 | 1.71 | 18 | 12 | 1 | 17.42 | 0.0 | 1.8 | 30.380 | 2 | 29.740 | 12 | AKQ | 2400 | |||||||||
| POR | 4.12 | -0.15 | 1.43 | 18 | 1.44 | 18-19 | 12 | 1 | 18.47 | 0.0 | 2.7 | 30.380 | 2 | 29.750 | 12 | 30.076 | AKQ | 2400 | ||||||||
| CTR | 3.52 | -0.49 | 1.10 | 18 | 1.19 | 17-18 | 13 | 1 | 19.72 | 0.0 | 9.5 | 30.370 | 2 | 29.720 | 11 | 30.039 | AKQ | 2400 | ||||||||
| MEC | 3.94 | 1.17 | 8 | 1.6 | 8,9 | 11 | 1 | 19.98 | 0.0 | 10.9 | AKQ | 2400 | ||||||||||||||
| RIC | 2.50 | -1.28 | 0.76 | 7 | 1.00 | 6-7 | 10 | 0 | 18.88 | 0.0 | 8.6 | 30.430 | 2 | 29.760 | 12 | AKQ | 2400 | |||||||||
| ROA | 4.91 | 0.85 | 1.41 | 6 | 1.69 | 6-7 | 14 | 1 | 20.54 | 0.0 | 18.3 | 30.380 | 2 | 29.770 | 11 | RNK | 2400 | |||||||||
| WAL | 1.39 | -1.56 | 0.73 | 7 | 0.73 | 7 | 9 | 0 | 18.07 | 0.0 | 8.4 | 30.270 | 27 | 29.720 | 24 | AKQ | 2400 | |||||||||
| WOO | 6.27 | 2.08 | 2.83 | 7-8 | 10 | 2 | 18.07 | 0.0 | 32.2 | 30.480 | 2 | 29.970 | 11,12 | LWX | 0800 | |||||||||||
| WSH | 5.56 | 1.50 | 4.00 | 7 | 4.07 | 7-8 | 12 | 1 | 17.47 | 0.0 | 42.7 | 30.460 | 2 | 29.740 | 15 | LWX | 2400 | |||||||||
| Averages | 4.12 | 0.10 | 1.49 | 1.69 | 11.4 | 1.0 | 17.77 | 0.0 | 11.8 | 30.403 | 29.746 | 35.092 | ||||||||||||||
| STN | T | T1 | U | U1 | V | V1 | W | X | Y | Z | 1 | 2 | 3 | 4 | 5 | 6 | 6A | 7 | 7A | 8 | CWA | TIME RECORDED | ||||
| STN | T | T1 | U | U1 | V | V1 | W | X | Y | Z | 1 | 2 | 3 | 4 | 5 | 6 | 6A | 7 | 7A | 8 | CWA | TIME RECORDED | ||||
| AVL | 7.78 | 4.12 | 3.40 | 5 | 3.50 | 4-5 | 11 | 2 | 29.12 | 0.0 | 0.5 | 30.320 | 25 | 29.770 | 6 | GSP | 2400 | |||||||||
| MRH | 2.43 | -1.50 | 1.57 | 6 | 1.59 | 5-6 | 7 | 1 | 18.82 | 0.0 | T | 30.300 | 30 | 29.780 | 24 | MHX | 2400 | |||||||||
| CLT | 3.00 | -0.18 | 1.60 | 6 | 2.12 | 5-6 | 10 | 1 | 18.75 | 0.0 | 2.7 | 30.320 | 25 | 29.810 | 11 | GSP | 2400 | |||||||||
| ECG | 1.19 | -2.42 | 0.67 | 18 | 0.67 | 18 | 7 | 0 | 10.67 | 0.0 | T | 30.360 | 2 | 29.760 | 12 | AKQ | 2400 | |||||||||
| FAY | 4.52 | 1.25 | 1.47 | 20 | 1.96 | 19-20 | 9 | 2 | 15.88 | 0.0 | 29.770 | 11 | RAH | 2400 | ||||||||||||
| GSO | 3.08 | -0.30 | 1.58 | 6 | 1.58 | 6 | 11 | 1 | 18.35 | 0.0 | 3.6 | 29.770 | 11 | RAH | 2400 | |||||||||||
| HSE | 3.37 | -0.20 | 2.15 | 23 | 2.33 | 22-23 | 6 | 1 | 19.19 | 0.0 | 0.0 | 29.780 | 12 | MHX | 2400 | |||||||||||
| HKY | 5.57 | 1.89 | 1.72 | 6 | 3.18 | 5-6 | 12 | 2 | 22.77 | 30.290 | 2 | 29.750 | 11 | GSP | 2400 | |||||||||||
| LBT | 3.12 | 0.07 | 1.04 | 20 | 1.47 | 19-20 | 11 | 1 | 14.48 | 30.300 | 25 | 29.800 | 12 | ILM | 2400 | |||||||||||
| EWN | 2.26 | -0.91 | 0.70 | 19 | 1.03 | 19-20 | 9 | 0 | 9.57 | 0.0 | T | 30.490 | 21 | 29.680 | 12 | MHX | 2400 | |||||||||
| RDU | 4.52 | 1.25 | 1.47 | 20 | 1.96 | 19-20 | 9 | 2 | 19.03 | 0.0 | 1.7 | 29.770 | 11 | RAH | 2400 | |||||||||||
| RAL | 5.39 | 2.12 | 9 | 3 | 20.38 | 0.0 | 3.2 | 30.300 | 2 | 29.800 | 23 | RAH | 2400 | |||||||||||||
| ROX | 3.59 | -0.22 | 1.5 | 6 | 1.5 | 6 | 9 | 1 | 17.75 | 5.6 | 30.38 | 1,2 | 29.80 | 11 | 30.11 | RAH | 2400 | |||||||||
| WHI | ILM | 2400 | ||||||||||||||||||||||||
| ILM | 1.30 | -3.19 | 0.41 | 6 | 0.42 | 5-6 | 9 | 0 | 16.72 | 0.0 | T | 30.290 | 25 | 29.790 | 24 | ILM | 2400 | |||||||||
| Averages | 3.65 | 0.13 | 1.48 | 1.79 | 9.21 | 1.21 | 17.96 | 0.0 | 1.6 | 30.335 | 29.774 | |||||||||||||||
| STN | T | T1 | U | U1 | V | V1 | W | X | Y | Z | 1 | 2 | 3 | 4 | 5 | 6 | 6A | 7 | 7A | 8 | CWA | TIME RECORDED | ||||
| STN | T | T1 | U | U1 | V | V1 | W | X | Y | Z | 1 | 2 | 3 | 4 | 5 | 6 | 6A | 7 | 7A | 8 | CWA | TIME RECORDED | ||||
| AND | 4.60 | 1.43 | 1.51 | 22 | 1.91 | 4-5 | 10 | 2 | 21.60 | 30.310 | 25 | 29.780 | 6 | GSP | 2400 | |||||||||||
| CAE | 3.62 | 0.65 | 2.17 | 5 | 2.22 | 4-5 | 5 | 1 | 18.62 | 0.0 | T | 30.320 | 25 | 29.780 | 5 | CAE | 2400 | |||||||||
| CRE | 2.38 | -1.03 | 1.09 | 20 | 1.09 | 20 | 10 | 1 | 17.44 | 30.300 | 25 | 29.810 | 24 | ILM | 2400 | |||||||||||
| CHS | 2.99 | -0.03 | 1.41 | 21 | 1.42 | 20-21 | 7 | 2 | 23.44 | 0.0 | T | 30.310 | 25 | 29.790 | 5 | CHS | 2400 | |||||||||
| FLO | 4.84 | 1.58 | 1.77 | 20 | 3.07 | 19-20 | 10 | 2 | 18.83 | 30.320 | 25 | 29.810 | 24 | ILM | 2400 | |||||||||||
| GSP | 5.77 | 2.01 | 3.19 | 5 | 3.76 | 4-5 | 10 | 1 | 23.16 | 0.0 | 2.0 | 30.290 | 25 | 29.780 | 6 | GSP | 2400 | |||||||||
| OGB | 2.58 | -0.64 | 1.24 | 5 | 1.24 | 5 | 6 | 1 | 17.38 | 30.340 | 25 | 29.790 | 15 | CAE | 2400 | |||||||||||
| Averages | 3.83 | 0.57 | 1.77 | 2.10 | 8.29 | 1.43 | 20.07 | 0.0 | 0.7 | 30.313 | 29.791 | |||||||||||||||
| STN | T | T1 | U | U1 | V | V1 | W | X | Y | Z | 1 | 2 | 3 | 4 | 5 | 6 | 6A | 7 | 7A | 8 | CWA | TIME RECORDED | ||||
| TRI | 4.09 | 0.29 | 0.84 | 23 | 1.15 | 22-23 | 17 | 0 | 24.69 | 0.0 | 6.7 | 30.350 | 25 | 29.73 | 6 | MRX | 2400 | |||||||||
| DAV | 4.68 | 1.63 | 8 | 16 | 1 | 24.11 | T | 14,25 | 2 | 0 | T | 223.8 | PBX | 2400 | ||||||||||||
| Averages | ||||||||||||||||||||||||||
| STN | T | T1 | U | U1 | V | V1 | W | X | Y | Z | 1 | 2 | 3 | 4 | 5 | 6 | 6A | 7 | 7A | 8 | CWA | TIME RECORDED | ||||
Virginia:
Arlington - " THE MONTHLY AVERAGE TEMPERATURE FOR MAY WAS NEAR NORMAL. IT WAS THE FIRST TIME SINCE 2009 THAT THE MAY AVERAGE TEMPERATURE FOR WASHINGTON DC WAS NOT WELL ABOVE NORMAL. THE FIRST 90-DEGREE DAY OF THE MONTH DID NOT OCCUR UNTIL THE 29TH... WHICH IS THE LATEST WITHOUT A 90-DEGREE DAY IN MAY SINCE 2009. THERE WERE NO 90-DEGREE DAYS RECORDED IN MAY 2009. THE MINIMUM TEMPERATURE OF 42F DEGREES ON THE 14TH WAS THE LOWEST TEMPERATURE IN MAY SINCE 3 MAY 2005 WHEN IT WAS 38F DEGREES. NO DAILY TEMPERATURE RECORDS WERE SET THIS MONTH. RAINFALL THIS MONTH WAS BELOW NORMAL. NEARLY HALF OF THE MONTHLY PRECIPITATION FELL ON THE 28TH. THE 1.34 INCHES OF RAIN THAT FELL ON THE 28TH WAS THE HIGHEST DAILY RAINFALL AMOUNT RECORDED IN MAY SINCE 26 MAY 2009 /1.65 INCHES/. " - [ + - ] - from NWS Sterling, VABridgewater - from Clayton Towers: " The temperature for the month was about normal. The precipitation for the year is 13.04", well-below normal . We need rain! We haven't had a strong thunderstorm so far this year. The month was rather quiet! " - [ -/+ - ]
Chantilly - from Russ Topping: " This May was warmer and drier than average. The mean monthly temperature was 64.8° (+1.6°). The mean high temperature was 75.8° (+0.7°) and the mean low temperature was 53.8° (+2.6°). A new record high temperature was set on the 22nd (89.2°). A record high minimum temp was set on the 21st (59.4°) and 22nd (68.4°). May brought more rainfall than April with 3.92", but was still below our norm (-0.63"). Thunderstorms were observed on the 7th, 10th, 23rd, 28th, and 30th. *Please note, anemometer is currently partially obstructed from the North and East " - [ + - ]
Dulles - from NWS Sterling (KLWX): " THE MONTHLY AVERAGE TEMPERATURE FOR MAY WAS NEAR NORMAL. IT WAS THE FIRST TIME SINCE 2008 THAT THE MAY AVERAGE TEMPERATURE FOR DULLES WAS NOT WELL ABOVE NORMAL. THE MINIMUM TEMPERATURE OF 32F DEGREES ON THE 14TH TIED A DAILY RECORD LOW THAT WAS SET IN 1996. IT WAS ONLY THE 4TH TIME DULLES RECORDED A MINIMUM TEMPERATURE OF 32F DEGREES OR COLDER THIS LATE IN THE SPRING. THE OTHER OCCURRENCES WERE 17 MAY 1984 (30F)...22 MAY 2002 (31F) AND 14 MAY 1996 (32F). RAINFALL THIS MONTH WAS BELOW NORMAL. " - [ + - ]
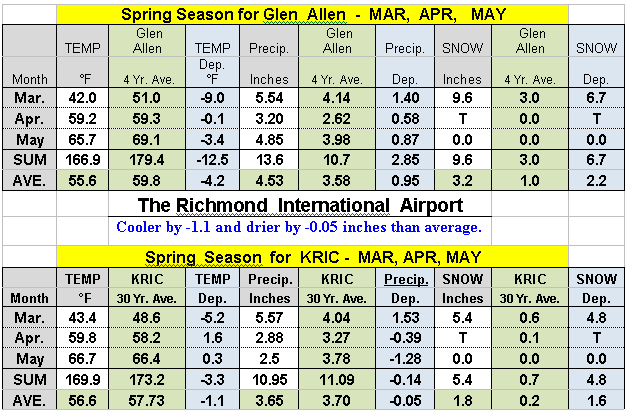
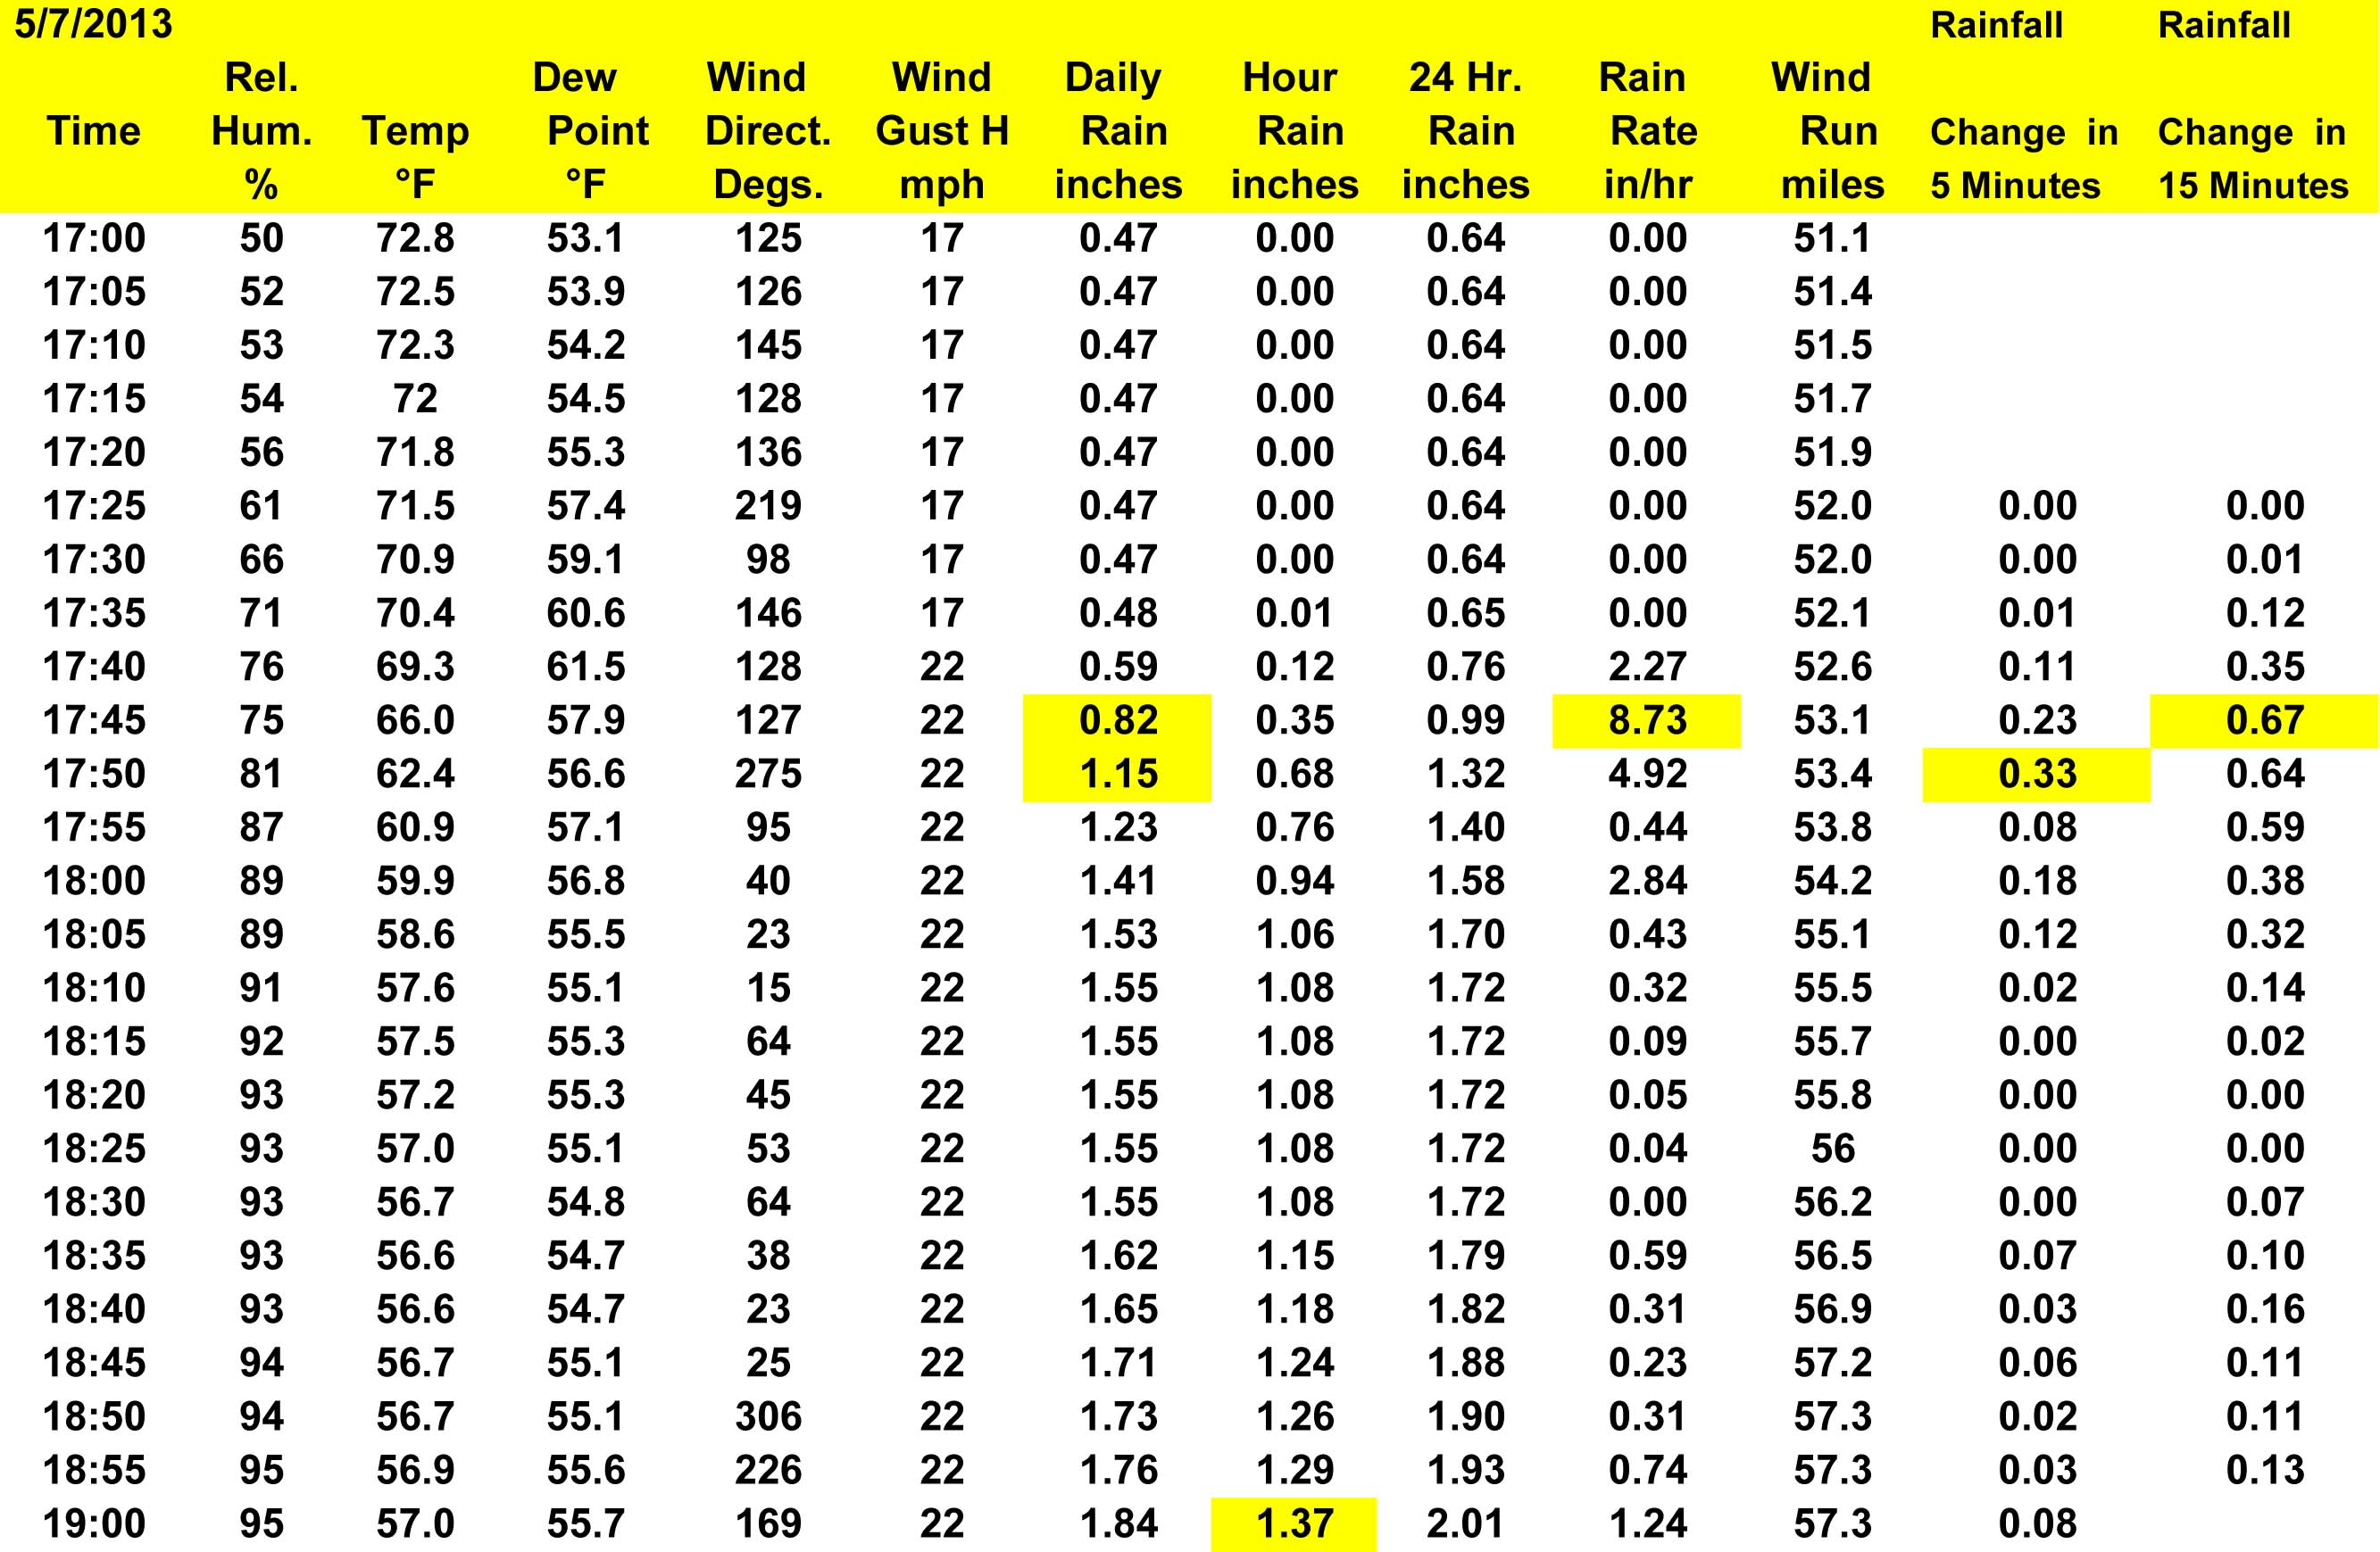
Glen Allen - from Lowell Koontz: " May was the coolest May on record and averaged 4.6 °F cooler than May last year as the monthly mean temperature was 65.7 °F, a negative 3.4 °F departure. May was above average in precipitation when compared to Glen Allen’s 4-year average. The maximum temperature for May was 89 °F on the 30th and 31st and the minimum was 36 °F on the 14th causing a light patchy frost our first May frost. May 2013 had more wind than any other May on record with a wind run of 2,165 miles. The windiest day was May 15th with a wind run of 152.6 miles. However the maximum wind gust for May was only 28 mph. May was just a little cleaner than average. The 4.85 inches of precipitation for May was a +0.87 inch departure when compared to the average. May had 2.39 inches of rain in a local thunderstorm on May 7th which set a new daily record for May. This was the most rain to fall in one hour here since August 24, 2009 when 1.44 inches was recorded. It also set a new May hourly record of 1.37 inches, a new 15-minute record of 0.67 inches and a new 5-minute record of 0.33 inches. May had 12 days with measurable rainfall. The link below is for data during the May 7th thunderstorm. http://www.glenallenweather.com/historylinks/2013/may/Recordrainfallrate.jpg May 7th thunderstorm with hail – A small cell rapidly intensified into a slow moving thunderstorm. Light rain started at 1715 and heavy rain started between 1735 and 1740 and hail occurred around 1740-1745. Hail was small pea size and milky (not clear) with the largest being 3/8 inches in diameter. This left the deck about 50 percent covered by a layer of small hail during a period of heavy rain. The hail then started again about 1758 and was larger marble size (0.5 inches) with a milky center but clear ice on the outside layer. Most were rounded but some had a platelet shape and this second 3-4 minutes of hail damaged garden plants. The Spring Season average was cooler by -4.2 and wetter by +0.95 inches than average. (4-Year Average)
The Airport had no new records for May but was the coolest May since 2008 and coolest spring since 2005. May was the 41st driest in the past 141 years and the 45th warmest in the past 133 years. " - [ - + ]
Herndon - from Randy Ashby: " May was below normal for temperature and precipitation. The temperatures ranged between a high of 90 and a low of 34 (note that 34 was the lowest low temperature in May for my site of over 20 years). On the precipitation side, the month was 1.33” below normal with 3.49” measured. We are now about 2.5” below normal for the year. " - [ - - ]
Portsmouth - from Bill Trotter: " May's average temperature of 68.0° was 0.3° ABOVE NORMAL. Precipitation (4.12") was BELOW NORMAL by 0.15" or 97% of the normal May average during the period from 1977 to 2012. Rainfall for the year-to-date through May 31st was 18.47" (-0.01") and 97% of normal. Cold frontal passages occurred on the 12th, 17th, 24th. STATION RECORDS: 14th - TEMPERATURE Minimum TIED 43° [previously 2008], 16th - TEMPERATURE Maximum TIED 91° [previously 1998], 25th - TEMPERATURE Minimum 48° [previously 51° 1990], 25th - WIND GUST 30mph [previously 29mph 1997], 26th - TEMPERATURE Minimum 48° [previously 51° 1979]. - [ + - ]
North Carolina:
Raleigh - from NWS RAH: " A RECORD LOW TEMPERATURE OF 39 DEGREES WAS SET AT RALEIGH-DURHAM INTL AIRPORT ON MAY 14. THIS BREAKS THE OLD RECORD OF 43 SET IN 1997. A RECORD HIGH MINIMUM TEMPERATURE OF 69 DEGREES WAS SET AT THE RALEIGH-DURHAM INTL AIRPORT ON MAY 22. THIS TIES THE OLD RECORD SET IN 1944. A RECORD LOW TEMPERATURE OF 41 DEGREES WAS SET AT RALEIGH-DURHAM INTL AIRPORT ON MAY 25. THIS BREAKS THE OLD RECORD OF 43 SET IN 1967. " - [ - + ]
Raleigh - from Bob Woodson: " MAY WEATHER WAS SIMILAR TO APRIL, WITH WET CONDITIONS AND MILD TEMPERATURES. PRECIPITATION OF 5.39” WAS 2.12” ABOVE NORMAL AND FOR THE YEAR IS NOW 3.16” ABOVE NORMAL. THE AVERAGE DAILY TEMPERATURE 66 DEGREES OR 2.0 DEGREES BELOW NORMAL. IT IS UNUSUAL THAT THE MAXIMUM TEMPERATURE NEVER REACHED THE 90-DEGREE MARK. ALONG WITH THE LOWER TEMPERATURES, NO SEVERE WEATHER WAS OBSERVED DURING THE MONTH. " - [ - + ]
COLUMN DENOTATIONS:
| A maximum mean temperature | T total precipitation (inches)
T1 departure from normal |
| B minimum mean temperature | U maximum calendar day precipitation (inches) |
| C monthly mean temperature
C1 departure from normal |
U1 date of maximum calendar day precipitation |
| D maximum temperature | V date(s) of maximum daily precipitation |
| E date(s) of maximum temperature | V1 maximum 24-hour precip. & date(s) |
| F minimum temperature | W number of days with precip. >= .01" |
| G date(s) of minimum temperature | X number of days with precip. >= 1.0" |
| H days with maximum temperature >=90 | Y year-to-date precipitation (inches) |
| I days with maximum temperature <=32 | Z maximum calendar day snowfall (inches) |
| J days with minimum temperature <=32 | VRB Variable |
| K days with minimum temperature <= 0 | 1 date of maximum calendar day snowfall (inches) |
| K1 average relative humidity | 2 number of days with snowfall |
| L peak wind gust (miles per hour) | 3 number of days with snowfall >= 1.0" |
| M direction of peak wind gust | 4 total snowfall for month (inches) |
| N date(s) of peak wind gust | 5 total snowfall for 2012-2013 season (inches) |
| N1 average wind speed (miles per hour) | 6 maximum barometric pressure (inches) |
| N2 dominant wind direction | 6A date of maximum barometric pressure |
| O number of days with thunder | 7 minimum barometric pressure (inches) |
| P number of days with hail | 7A date of minimum barometric pressure |
| Q number of days with glaze | 8 average sea-level pressure |
| R number of days with ice pellets | STN Station |
| NR not recorded | |
| R1 number of days with dense fog [1/4 mile and less visibility] | (i) incomplete data |
| S local observation time for temps/precipitation | (M) missing, if listed in data table |
| ~ "about" | E estimated |
| + additional indeterminate number of days | CWA - NWS Office County Warning Area |

For Weather Headlines
visit the National Weather Service Homepage
or conduct a Google.com Search
http://www.weather.gov
National
Weather Service Web Sites & Current Email Addresses
Within or
Nearby the ACON VA/NC/SC Area Can Be Found At:
NWS Washington/Baltimore,
VA/MD
NWS Wakefield, VA
NWS Blacksburg, VA
NWS Raleigh, NC
NWS Newport/Morehead City, NC
NWS Wilmington, NC
NWS Greenville-Spartanburg, SC
NWS Columbia, SC
NWS Charleston, SC
NWS Morristown, TN
National Weather Service Homepages
National Climatic Data Center, Asheville, NC
STATION / LOCATION (MILES & DIRECTION FROM MAIN POST OFFICE)/OBSERVER / YEAR RECORDS BEGAN / EMAIL ADDRESS:
| AKQ Wakefield, VA NWS Wakefield Municipal Airport 36-58-53N 077-00-04W 33M | |
| DCA Arlington, VA Washington, DC, Reagan Washington National Airport 38-50-54N 077-02-03W 18M | WSH Washington, VA David Yowell runamok@runamok.com |
| BCB Blacksburg, VA NWS Virginia Tech Airport 37-13N 080-25W | |
| WOO Woodstock, VA 5NW Lauck Walton 12/1/85 jwalton@shentel.net | |
| LDY Ladysmith, VA Danny Jessee 2003 STATION CLOSED 8/31/2010 danny@dannyjessee.com | |
| BRI Bridgewater, VA Clayton Towers Ctowers19@aol.com | WAL Wallops Island, VA 37° 56'26" N 75° 27'47" W Wallops Flight Facility Airport | CEN Centreville, VA Paul Bassett 1985, 38° 50.9788' N LAT. 77° 25.6374' W LON. | Elevation 324' | m.psb@verizon.net | AVL Asheville, NC Asheville Regional Airport 35-25-55N 082-32-15W 670M |
| CHO Charlottesville, VA Charlottesville-Albemarle Airport ASOS (Rappahannock County) 38-08-18N 078-27-21W 192M | MRH Beaufort, NC Michael J. Field Airport 34-44-01N 076-39-38W 3M |
| DAN Danville, VA, Danville Regional Airport, 36-34-22N 079-20 10W 175M | CLT Charlotte, NC NWS Charlotte/Douglas International Airport 35-12-48N 080-56-55W 220M |
| IAD Dulles - Washington-Dulles International Airport 38-56-05N 077-26-51W 93M | |
| FCH Falls Church, VA Erica Page 3/7/94 Windie1970@aol.com | HKY Hickory, NC |
| HAM Hampton, VA 5NE Dave Kessel 1989 davidkessel@cox.net | ECG Elizabeth City, NC, Coast Guard Air Station 36-15-47N 076 10-58W 11M | LYH Lynchburg, VA NWS Lynchburg Regional Airport 37-19-15N 079-12-24W 295M | ILM Wilmington, NC NWS New Hanover International Airport 34-16-06N 077-54-22W 9M |
| CTR Winterpock in Chesterfield County, VA Albert Arnold 06/03 | FAY Fayetteville, NC Fayetteville Regional Airport, 34-59-22N 078-52-48W 55M |
| GSO Greensboro, NC NWS Piedmont Triad International Airport 36-05-51N 079-56-37W 275M | |
| CHT Chantilly, VA Russ Topping - 12/2006 russ.topping@gmail.com - new location December 2006 | HSE Cape Hatteras, NC Mitchell Field 35-13-56N 075-27-21W 3M |
| HDV Herndon, VA Randoplh W. Ashby, 3.3 SM South, Lat: 38.922127, Lon: -77.38015, Elev: 390'. Randolph_Ashby@Raytheon.com | LBT Lumberton, NC Lumberton Municipal Airport 34-36-26N 079-03-36W 37M |
| GAV - Glen Allen, Henrico County, VA - Lowell Koontz 8/1/08 wwkoontz@verizon.net | EWN New Bern, NC Craven County Regional Airport 36-04-03N 077-02-50W 3M |
| MON Moncure, NC Chatham County - Mac McIlwain mac.mcilwain@embarqmail.com | |
| RAL Raleigh, NC 7NNW Bob Woodson - 6/1/93 kf4mmm@qsl.net | |
| LKU Louisa, VA 1N Joseph Bowers 1944 - NWS ID 44-5050-02 STATION CLOSED | RDU Raleigh-Durham, NC Raleigh-Durham International Airport 35-52-14N 078-47-11W 130M |
| LOU Louisa, VA 6S John Bullock (about 1970) STATION CLOSED | ROX Roxboro, NC 2SE Merriell A. Jay 1/93 |
| WHI North Whiteville, NC Christopher Crawley 12/10 34.413744N / 078.751908W | |
| LYH Lynchburg, VA NWS Lynchburg Regional Airport 37-19-15N 079-12-24W 295M | ILM Wilmington, NC NWS New Hanover International Airport 34-16-06N 077-54-22W 9M |
| NEW Newmarket, VA 2W Joyce Winfree STATION CLOSED 5/31/10 joywood@shentel.net | CHS Charleston, SC NWS Charleston Air Force Base 32-53-56N 080-02-26W 13M |
| NPN Newport News, VA 7N Gary Leonard - 6/91 GaryMLeonard@aol.com | CAE Columbia, SC NWS Columbia Metropolitan Airport 33-56-31N 081-07-05W 73M |
| NOR Norfolk, VA 3NE Jim Fentress 6/1/77 | FLO Florence, SC Florence Regional Airport 34-11-16N 079-43-51W 44M |
| ORF Norfolk, VA 5NE 36-54-13N 076-11-31W 14M 1871 | GSP Greenville-Spartanburg, SC NWS Greenville-Spartanburg Airport 34-53-02N 082-13-15W 286M |
| POR Portsmouth, VA 36.81° North 76.33° West 3S Bill Trotter - 7/1/76 wxr@cox.net | CRE North Myrtle Beach, SC Grand Strand Airport 33-48-42N 078-43-26W 10M |
| MEC Mechanicsville, VA Glen Martin 11/19/91 | OGB Orangeburg, SC Orangeburg Municipal Airport 33-27-50N 080-51-13W 59M |
| FHC Norfolk, VA Fred Heutte Center 36° 54'N 76° 16'W 01/01/03 fhcgarden@cox.net | AND Anderson, SC |
| RIC Richmond, VA Richmond International Airport 37-30-40N 077-19-24W 50M | TRI Tri-cities, TN (Bristol / Johnson / Kingsport), Tri-City Regional Airport 36-28-47N 082-23-56W 474M |
| ROA Roanoke, VA Roanoke Regional Airport 37-19-01N 079-58-27W 362M | DAV Davis, WV Dave Lesher canaanwx@yahoo.com |