Member Profile - Lowell Koontz
[below]

ACON
- VA/NC/SC
The Atlantic
Coast Observer Network:
Virginia,
North Carolina, South Carolina
http://members.cox.net/wxr/acon.htm
SUMMARY OF
CLIMATOLOGICAL DATA
OCTOBER 2004
...TEMPERATURES SLIGHTLY BELOW TO ABOVE NORMAL FOR VIRGINIA,
BUT ABOVE NORMAL IN THE CAROLINAS...
...RAINFALL GENERALLY BELOW NORMAL...
It's certainly good to read of your reports of a more tranquil weather month even if there
seemed a lot of "hot air" from the political atmosphere surrounded us!
The visits from the remnants of tropical systems during the previous two
months came to an end, although RAH noted some residual moisture from Matthew
getting caught up in a mid-month cold frontal passage.
Most stations noted below normal rainfall while temps in the Carolinas were
above normal, as they were likewise in the western portions of Virginia. Quite a few stations
in Central and Eastern Virginia noted slightly below normal temps with increased
cloud cover and onshore air flow. "Indian Summer", with its characteristic mild to warm, dry afternoon temps - wasn't as
noticeable this year throughout the region. RAH noted in its monthly
summary for October 2004: "The main storm track during October remained
well to our north, as an upper level ridge of high pressure dominated the
south central and southeastern states. At the surface, this upper level
pattern favored the development of high pressure systems over southeastern Canada and New England."
This translated to cooler temps for the coastal plains and warmer temps for
the mountainous areas."
'Tis time to reset your seasonal snowfall totals with the first measurement
by Dave Lesher at Davis (WV).
-
NEW SNOWFALL SEASON BEGINS
so please start your new seasonal
totals
-
2004 ATLANTIC HURRICANE SUMMARY
http://www.ncdc.noaa.gov/oa/climate/research/2004/hurricanes04.html
-
U.S. DAILY WEATHER MAPS PROJECT
Looking for that NOAA Daily Weather
Map for a given date since 1871? Look no further! Visit the NOAA Central Library
U.S. Daily Weather Maps Project [1871-2001] at http://docs.lib.noaa.gov/rescue/dwm/data_rescue_daily_weather_maps.html.
A link to maps for 2002 to the present is found at the top of the page. Great resource! Note:
You will need to download and install a small program in order to view the
maps.
-
REMINDER
All National Weather Service station data listed
herein is preliminary and may be subject to change. The data has
not been certified and cannot be used in legal actions. Only reports
certified by the National Climatic Data Center in Asheville, NC can
be used for these purposes.
 A Visit With St. Lowell
[ Click image to the left to enlarge ]
Just in the past few days of Thanksgiving 2004, I realized the holiday rush was
on as the seasonal music was "ablare" on the radio. I heard a recorded recitation of "A Visit from
Saint Nick" and it reminded me that I have yet to share my pics from a recent trip (my second) to
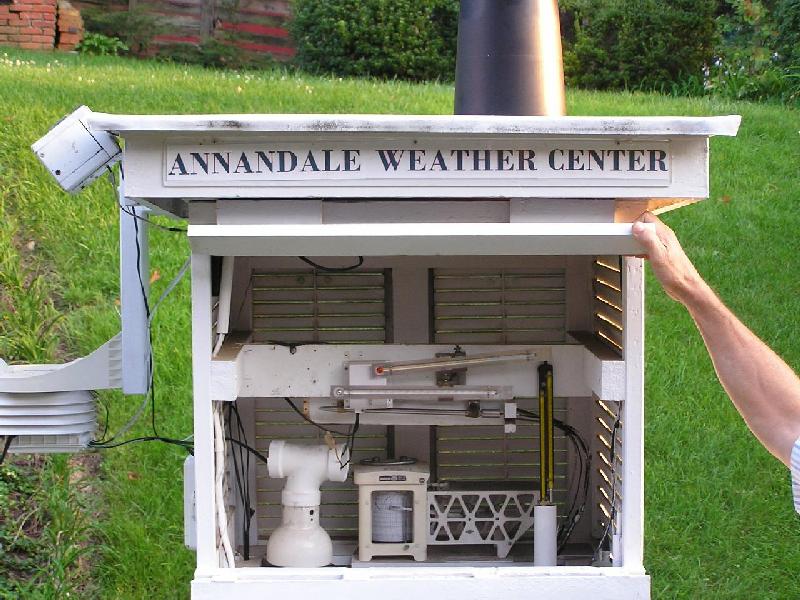
Annandale, Virginia, home of our "Saint Lowell," the patron saint of weather and the home
of his Annandale Weather Station!
No weather group has a "patron saint" quite like Lowell, a member of
our online ACON VA/NC/SC weather group since 1995 and whose records date back to 1980.
If you've had friends refer to you as a "weathernut", a label most of us take as complimentary,
then you must know that our Lowell is the "weathernut of weathernuts!"
Lowell, a retired science teacher in Northern Virginia, has the most comprehensive weather
station I've ever seen! A visit to his home is quite an effort as Annandale is a suburb of
DC and the traffic is horrendous, 24/7! Once you've navigated the main roads and
backstreets of Annandale, you'll realize your time was worth the effort!
Once there, Lowell's face lights up and remains
aglow as he shows you (with great pleasure) everything he has weatherwise!
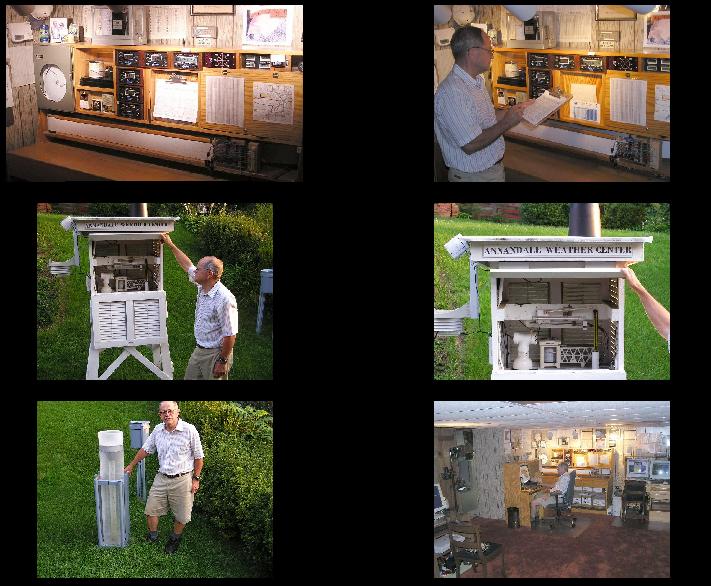
His basement is a weather control center that would rival any NWS forecast
center!
I have no idea where to begin in describing Lowell's weather center, so I won't.
There's just too much of interest to try a beginning or set a focal point.
Take a look at the pictures
here and you'll be astounded with his weather center; so astounded that you find
yourself asking Lowell one question after another, seeking an understanding of how
this scientist has built the station, carefully selecting for purchase, as well
as handmaking, many of his instruments. The data he maintains is coordinated
and painstakingly displayed at his masterful weather website, Annandale - Barcroft Hills Weather.
Before departing Annandale, I asked Lowell, "Do you have any objections to our
members stopping by for a visit?" His reply was "Not at all!" So if you get a chance,
email him via this page or his webpage and down the road he can give you a tour of
the station when you're in town. Be sure to ask him about his unique weather instruments and
their adaptations (remember, he's a scientist!) including the use of a microphone in his
weather shed to notify him at his work desk it's sleeting outside! Oh, and then there's his
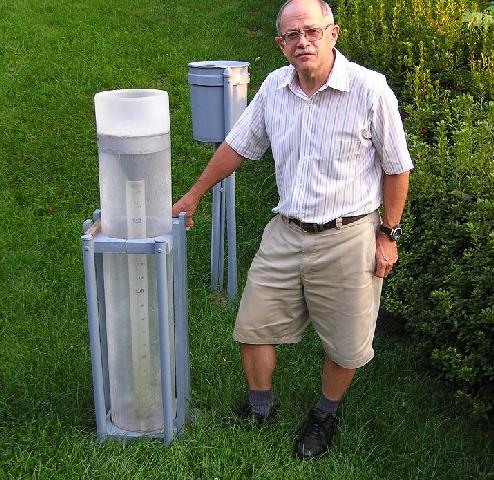
homemade (pictured) rainfall drum that depicts when rainfall begins and stops along
the continuum of the drum roll. The machinery is unbelieveable!
For us "weathernuts", a visit with Lowell will be well worth the time!
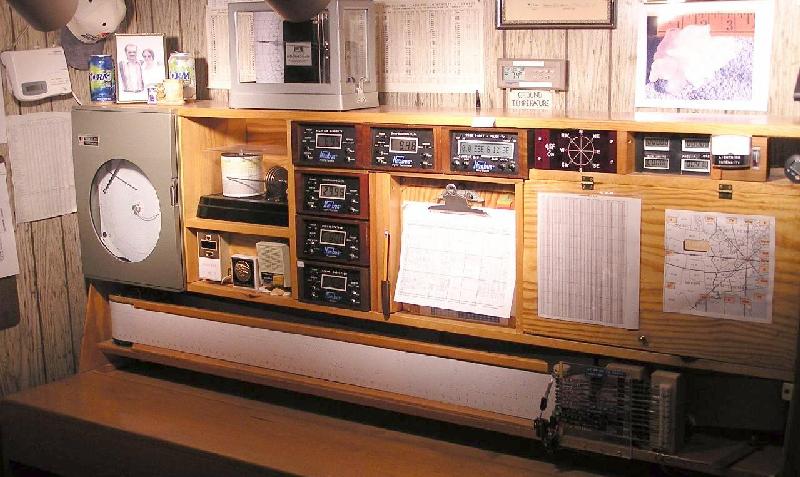
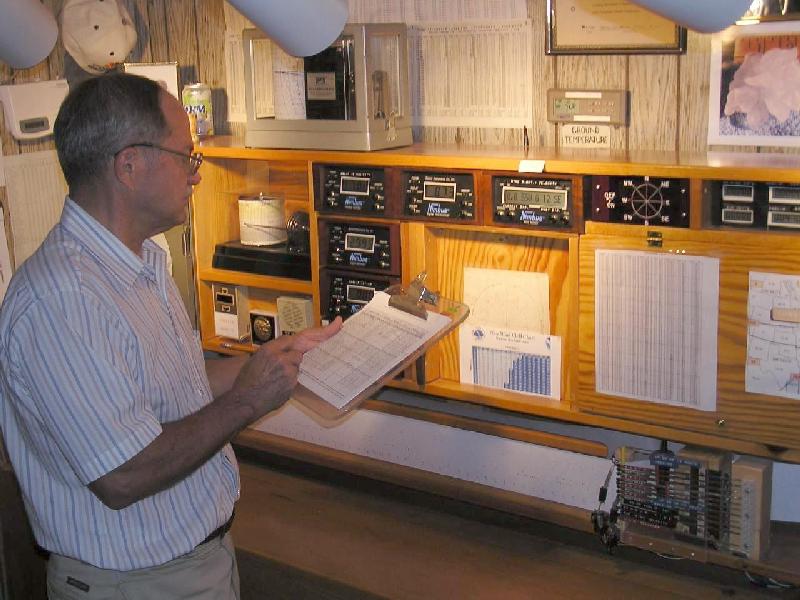
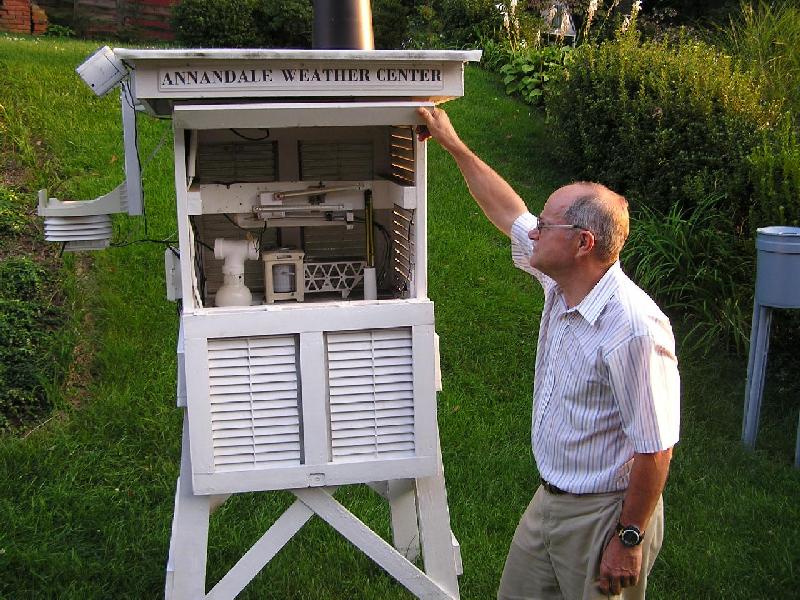
Pictorial Visit with Lowell:
Main obs desk closeup
Lowell "taking an ob"
Lowell at the weather shed
Closeup of shed
Lowell at homemade rain gauge
And this only one-half the room!
ACON VA/NC/SC Member
Station Extremes - OCTOBER 2004
|
State
|
Maximum Temperature
|
Minimum
Temperature
|
Warmest
Average
Temperature
|
Coldest
Average
Temperature
|
Maximum
Precipitation
|
Minimum
Precipitation
|
|
Virginia
|
85°
Hampton
|
32°
New Market
|
61.9°
Hampton
|
54.8°
Herndon (HRN)
|
3.83"
Wakefield
|
0.73"
Ruther Glen
|
|
North Carolina
|
86°
Lumberton, New Bern
|
36°
Asheville, Raleigh (RAL)
|
67.5°
Cape Hatteras
|
60.7°
Roxboro
|
4.02"
Elizabeth City
|
0.50"
Fayetteville
|
|
South Carolina
|
88�
Orangeburg
|
39°
Greenville-Spartanburg
|
69.0°
Charleston
|
63.8°
Greenville-Spartanburg
|
2.71"
Florence
|
0.59"
Columbia
|
(Please
note the column denotations table below.)
TEMPERATURE / WINDS/ ELEMENTS
VIRGINIA
[Reminder:
All NWS DATA HEREIN IS NOT OFFICIAL]
STN A B C C1 D E F G H I J K K1 L M N N1 N2 O P Q R R1 R2 S CWA
-----------------------------------------------------------------------------------------------------------
ANN 63.19 48.29 55.74 -0.3 75 31 38 12,18 0 0 0 0 80% 24 NNW 16 2 0 0 0 1 2400 LWX
24 W 17
24 NNW 31
BCB 65.5 47.1 56.3 +4.6 80 30 33 18 0 0 0 0 74% 38 240� 16 3.4 1 0 0 0 9 60% 2400 RNK
BRI 67.7 49.0 58.3 +3.2 80 28,29 35 12,18 0 0 0 0 0 0 0 0 1 2400 LWX
CEN 64.0 49.3 57.1 +2.2 78 31 37 18 0 0 0 0 25 006� 16 1 0 0 0 1 2400 LWX
CHO 65.7 47.5 56.6 -1.7 80 31 34 18 0 0 0 0 29 260� 16 2.9 0 0 0 0 6 2400 LWX
DAN 69.1 49.9 59.5 +1.3 82 31 39 17,18 0 0 0 0 80% 36 290� 16 3.8 3 0 0 0 7 50% 2400 RNK
DCA 65.7 50.8 58.3 -0.5 79 31 41 18 0 0 0 0 71% 51 260� 16 6.5 2 0 0 0 2 60% 2400 LWX
IAD 65.6 45.5 55.5 +0.5 81 31 31 18 0 0 1 0 43 240� 16 4.8 2 0 0 0 2 2400 LWX
FCH 2400 LWX
HAM 71.8 52.1 61.9 85 31 41 17 0 0 0 0 45 3 2 21 2400 AKQ
HER 63.2 47.3 55.2 +0.2 76.5 31 36.1 18 0 0 0 0 19 16 1+ 1 0 0 2400 LWX
HRN 63.8 46.2 54.8 -0.2 78.3 31 33.0 18 0 0 0 0 79% 30 SW 16 2.0 SSE 1 0 0 0 0 2400 LWX
LYH 66.2 48.5 57.3 +1.2 80 30 34 17 0 0 0 0 78% 31 230� 16 3.0 1 0 0 0 6 50% 2400 RNK
NEW 65.26 46.61 55.94 +0.9 80 30 32 18 0 0 0 0 58% 30 NW 16 1.5 S 0 0 0 0 5 1800 LWX
NPN 69.6 51.1 60.4 82 2,31 40 17 0 0 0 0 26 S 16 4 0 0 0 1 2400 AKQ
NOR 67.9 52.6 60.3 -0.3 81 31 42 17 0 0 0 0 1 0 0 0 1 2400 AKQ
ORF 67.7 54.2 60.9 -0.2 80 31 41 17 0 0 0 0 81% 45 270� 13 7.8 2 0 0 0 1 50% 2400 AKQ
FHC 68.23 54.97 61.6 81.2 31 47.0 17 0 0 0 0 82% 29 050� 13 3.0 023� 0 0 0 0 2400 LWX
POR 68.0 53.8 60.9 -0.6 80 31 44 17,18 0 0 0 0 81% 35 045� 13 2.45 132� 3 0 0 0 1 46% 2400 AKQ
MEC 67.45 50.22 59.09 81 31 37 18 0 0 0 0 3 0 0 0 3 1700 AKQ
RIC 68.9 51.4 60.1 +1.8 83 31 39 18 0 0 0 0 77% 33 250� 16 4.7 3 0 0 0 5 70% 2400 AKQ
RGL 67.46 48.90 58.18 -0.12 81.3 2 35.8 18 0 0 0 0 80% 26 S 16 1.0 N 0 0 0 0 0 2400 AKQ
ROA 67.2 51.4 59.3 +2.7 80 31 41 18 0 0 0 0 73% 38 290� 16 4.1 1 0 0 0 2 50% 2400 RNK
ROK 67.6 49.8 58.7 +2.5 83 30 37 18 0 0 0 0 23 NW 17 1 0 0 0 3 2300 RNK
AKQ 69 50 59.5 82 2 38 12,18 0 0 0 0 2400 AKQ
WAL 66.6 50.1 58.4 +0.4 80 31 39 18 0 0 0 0 36 300� 17 7.4 0 0 0 0 1 2400 AKQ
38 150� 18
WEE 69.1 50.1 59.6 82 31 38 18 0 0 0 0 0 0 0 0 0 1630 AKQ
WOO 62.4 48.7 55.5 -0.9 77 31 40 17 0 0 0 0 2 0 0 0 8 2400 LWX
WSH 63.4 47.8 55.6 75.7 31 37.2 17 0 0 0 0 16 16,17 0.6 E 1 0 0 0 0 2400 LWX
18
|
NORTH CAROLINA
[Reminder:
All NWS DATA HEREIN IS NOT OFFICIAL]
STN A B C C1 D E F G H I J K K1 L M N N1 N2 O P Q R R1 R2 S CWA
-----------------------------------------------------------------------------------------------------------
AVL 70.5 51.4 61.0 +5.8 79 31 36 17 0 0 0 0 40 290� 16 4.3 0 0 0 0 14 2400 GSP
35 040� 9
MRH 73.0 58.0 65.5 82 3 46 27 0 0 0 0 39 180� 18 8.1 6 0 0 0 2 2400 MHX
39 220� 28
CLT 71.5 54.6 63.0 +1.3 82 31 38 17 0 0 0 0 28 200� 16 4.4 2 0 0 0 4 2400 GSP
ECG 70.1 51.9 61.0 -1.6 83 31 42 7,17 0 0 0 0 84% 32 290� 15 8.2 4 0 0 0 9 40% 2400 AKQ
FAY 74.9 56.3 65.6 85 31 43 17 0 0 0 0 73% 36 240� 16 5.8 1 0 0 0 4 40% 2400 RAH
GSO 69.7 53.1 61.4 +2.9 81 31 40 17 0 0 0 0 78% 38 250� 16 5.9 1 0 0 0 8 50% 2400 RAH
HSE 72.5 62.4 67.5 +1.8 81 9 56 18,25 0 0 0 0 36 280� 15 8.8 0 0 0 0 1 2400 MHX
HKY 70.2 54.3 62.2 +3.0 82 31 44 17 0 0 0 0 31 330� 5 4.1 1 0 0 0 14 2400 GSP
LBT 75.1 54.4 64.7 +3.7 86 31 40 17 0 0 0 0 30 270� 15 4.7 0 0 0 0 8 2400 ILM
30 240� 16
EWN 73.1 54.7 63.9 +0.1 86 2 43 24 0 0 0 0 240� 16 5.5 3 0 0 0 10 2400 MHX
RAL 71.1 51.4 61.6 +1.6 83 31 36 17 0 0 0 0 28 16 4 0 0 0 2 2400 RAH
RDU 72.2 53.0 62.6 +2.6 84 31 38 17 0 0 0 0 77% 33 250� 16 4.7 3 0 0 0 5 70% 2400 RAH
ROX 70.0 51.3 60.7 +2.6 82 2 44 15 0 0 0 0 66% 29 N 15 N 0 0 0 0 8 55% 2200 RAH
ILM 75.3 56.5 65.9 +1.0 82 2,31 46 16,27 0 0 0 0 31 260� 15 6.1 2 0 0 0 6 2400 ILM
|
SOUTH CAROLINA
[Reminder:
All NWS DATA HEREIN IS NOT OFFICIAL]
STN A B C C1 D E F G H I J K K1 L M N N1 N2 O P Q R R1 R2 S CWA
-----------------------------------------------------------------------------------------------------------
AND 72.7 56.9 64.8 +3.6 73 2,31 41 16,17 0 0 0 0 36 260� 16 5.2 3 0 0 0 6 2400 GSP
CAE 75.6 58.0 66.8 +3.1 86 2,31 46 16 0 0 0 0 31 270� 15 4.8 0 0 0 0 4 2400 CAE
31 260� 16
CHS 77.5 60.4 69.0 +2.8 86 1,2 49 16 0 0 0 0 30 270� 15 6.1 2 0 0 0 6 2400 CHS
CRE 75.2 58.2 66.7 +1.9 85 31 45 16 0 0 0 0 38 220� 15 5.9 2 0 0 0 5 2400 ILM
FLO 74.7 57.5 66.1 +2.0 85 1,31 45 16,17 0 0 0 0 39 340� 3 5.9 2 0 0 0 7 2400 ILM
GSP 71.5 56.2 63.8 +3.3 83 31 39 17 0 0 0 0 41 240� 16 5.5 2 0 0 0 4 2400 GSP
OGB 76.5 57.8 67.2 88 2 44 16 0 0 0 0 30 250� 15 4.6 2 0 0 0 10 2400 CAE |
NEARBY STATIONS
[Reminder:
All NWS DATA HEREIN IS NOT OFFICIAL]
STN A B C C1 D E F G H I J K K1 L M N N1 N2 O P Q R R1 R2 S CWA
-----------------------------------------------------------------------------------------------------------
TRI 70.9 50.1 60.5 +5.5 80 1 31 17 0 0 1 0 43 230� 16 3.0 1 0 0 0 17 2400 MRX
DAV 57.8 41.0 49.4 68 8,31 29 18 0 0 4 0 1 1 0 0 5 1900 PBZ |
(Please
note the column denotations table below.)
PRECIPITATION / BAROMETRIC PRESSURE
VIRGINIA
[Reminder:
All NWS DATA HEREIN IS NOT OFFICIAL]
STN  T      T1     U  U1   V    V1   W X   Y     Z   1  2 3   4    5     6    6A   7    7A    8     S
-------------------------------------------------------------------------------------------------------
ANN  1.38  -2.00 0.35  2 0.36 19-20 11 0 35.10  0.0          0.0   0.0  30.48 6,7 29.38  15 30.06  2400
BCB  2.25  -0.94 0.81 13 0.81    13 15 0 40.13  0.0          0.0   0.0                             2400
BRI  1.75  -1.30 0.64 13 0.64    13  8 0 35.94  0.0          0.0   0.0  30.45     29.41            0515/1600
CEN  1.30  -2.43 0.39 20 0.59 19-20 10 0 33.75  0.0          0.0   0.0  30.49  21 29.39  15        2400
CHO  0.99  -3.23 0.33 13 0.33    13 13 0 30.55  0.0          0.0   0.0                             2400
DAN  1.94  -1.77 0.91 19 0.91    19 10 0 34.33  0.0          0.0   0.0  30.48   7 29.41  15        2400
DCA  1.74  -1.48         0.84   1-2 10 0 35.00  0.0          0.0   0.0  30.49   6 29.37  15        2400
IAD  1.05  -2.32 0.35 20 0.43 20-21 10 0 32.13  0.0          0.0   0.0                             2400
FCH                                      32.41  0.0          0.0   0.0                             2400
HAM  1.85        1.05 20 1.26 19-20  5 1        0.0          0.0   0.0                             2400
HER  1.25  -2.12 0.30 20 0.20    20 13 0 35.34  0.0          0.0   0.0                             2400
HRN  1.26  -2.11 0.37 20            12 0 34.90  0.0          0.0   0.00 30.443  7 29.360 15 30.02  2400
LXI                                      30.02 [through August 2004]                               2400
LYH  1.98  -1.41 1.45 13 1.45    13  9 1 30.29  0.0          0.0   0.0  30.50   7 29.42  15        2400
NEW  2.02  -0.50 0.55 14 0.64 14-15 12 0 32.17  0.0          0.0   0.0  30.46   7 29.86  15        1700
NPN  3.29        1.14 19 1.17 19-20  9 1 51.05  0.0          0.0   0.0  30.44   7 29.37  15        2400
NOR  2.06  -1.53 0.64 19             8 0 52.85  0.0          0.0   0.0                             2400
ORF  1.88  -1.59 0.62 19 0.64 19-20  8 0 48.09  0.0          0.0   0.0  30.48   7 29.41  15        2400
FHC  2.68        0.76 19             8 0 57.40  0.0          0.0   0.0  30.458  7 29.403 15 30.030 2400
POR  2.07  -1.48 0.53 19 0.56 19-20  9 0 43.68  0.0          0.0   0.0  30.476  7 29.419 15 30.045 2400
MEC  1.88        0.50 13 0.51 13-14 10 0 63.51  0.0          0.0   0.0  30.27   6 29.26  15        1700
RIC  1.95  -1.65         0.71 19-20 10 0 52.14  0.0          0.0   0.0  30.41  20 29.51  18        2400
RGL  0.73  -2.87 0.23 13 0.32 13-14  7 0 36.40  0.0          0.0   0.0  30.45   7 29.36  15 30.03  2400
ROA  2.38  -0.77 1.61 13 1.61    13 13 1 41.21  0.0          0.0   0.0  30.53   7 29.44  15        2400
ROK  2.51  -1.51 1.55 13 1.55 10-13 15 1 44.24  0.0          0.0   0.0  30.50   7 29.62  14        2400
AKQ  3.83        1.82 19            10 2 49.17  0.0          0.0   0.0                             2400
WAL  2.04  -0.83 1.33 19 1.35 19-20  7 1 42.93  0.0          0.0   0.0  30.47   7 29.40  15        2400
WEE  2.33        1.21 20 1.21    20  7 1                                30.44   7 29.39  15        1630
WOO  1.67  -0.58         0.36 20-21 14 0 34.60  0.0          0.0   0.0  30.51   7 29.56  15        0800
WSH  1.40  -1.41 0.24 24 0.24    24 13 0 41.03  0.0          0.0   0.0  30.49   7 29.38  15        2400
|
NORTH CAROLINA
[Reminder:
All NWS DATA HEREIN IS NOT OFFICIAL]
STN  T      T1     U  U1   V    V1   W X   Y     Z   1  2 3   4    5     6    6A   7    7A    8     S
-------------------------------------------------------------------------------------------------------
AVL  1.11  -2.07 0.34 12 0.35 12-13 10 0 43.91  0.0          0.0  0.0  30.46   7 29.46  15         2400
MRH  1.60        0.58 19 0.89 18-19  6 0        0.0          0.0  0.0                              2400
CLT  0.75  -2.91 0.33 13 0.33    13  9 0 38.33  0.0          0.0  0.0  30.48   7 29.50  15         2400
ECG  4.02  +1.16 2.03 13 2.03    13  6 1 43.11  0.0          0.0  0.0  30.46   7 29.45  15         2400
FAY  0.50        0.27 13 0.27    13  4 0 30.76  0.0          0.0  0.0  30.31  21 29.58  17         2400
GSO  0.62  -2.65 0.14 24 0.14    24  9 0 23.76  0.0          0.0  0.0                              2400
HSE  1.88  -3.43 1.18 15 1.19 14-15  5 1        0.0          0.0  0.0                              2400
HKY  2.58  -0.99 1.18 13 1.28 12-13 11 1 39.61  0.0          0.0  0.0  30.46   7 29.44  15         2400
LBT  0.90  -2.46 0.36 13 0.36    13  7 0 33.88  0.0          0.0  0.0  30.46   7 29.53  15         2400
EWN  1.31  -2.08 0.54 13 0.54    13  7 0        0.0          0.0  0.0                              2400
RAL  2.14  +1.04         1.56 12-13 10 1 40.16  0.0          0.0  0.0  30.46   7 29.44  15         1900
RDU  2.52  -0.66 1.19 13 1.19    13  7 1 41.78  0.0          0.0  0.0  30.49   7 29.44  15         2400
ROX  1.99  -1.67 1.10 19 1.10 19  9  1 0 30.48  0.0          0.0  0.0  30.48   7 29.41  15  29.95  2100
ILM  1.98  -1.23 0.64 19 0.64    19 11 0 46.21  0.0          0.0  0.0                              2400
|
SOUTH CAROLINA
[Reminder:
All NWS DATA HEREIN IS NOT OFFICIAL]
STN  T      T1     U  U1   V    V1   W X   Y     Z   1  2 3  4     5     6    6A   7    7A    8    S
------------------------------------------------------------------------------------------------------
AND  0.75  -2.48 0.28 24 0.28    24  9 0 38.49  0.0          0.0  0.0  30.45   7 29.54  15        2400
CAE  0.59  -2.30 0.41 24 0.41    24  5 0 42.90  0.0          0.0  0.0  30.45   7 29.55  15        2400
CHS  1.38  -1.71 0.50  2 0.50     2  9 0 36.83  0.0          0.0  0.0  30.43   7 29.59  13        2400
CRE  1.73  -1.50 0.74  1 0.74     1  7 0 42.03  0.0          0.0  0.0  30.45   7 29.52  15        2400
FLO  2.71  -0.23 1.54  3 1.55   3-4  6 1 37.27  0.0          0.0  0.0  30.46   7 29.53  15        2400
GSP  0.87  -3.01 0.32  2 0.33   2-3  9 0 37.55  0.0          0.0  0.0  30.44   7 29.49  15        2400
OGB  0.75        0.40 15 0.40    15  5 0 36.10  0.0          0.0  0.0  30.45   7 29.56  15        2400
|
NEARBY STATIONS
[Reminder:
All NWS DATA HEREIN IS NOT OFFICIAL]
STN  T      T1     U  U1   V      V1   W X   Y     Z   1  2 3  4     5    6   6A   7   7A    8     S
------------------------------------------------------------------------------------------------------
TRI  3.35  +1.05 0.91 19 1.14 18-19 11 0 41.39  0.0           0.0   0.0                           2400
DAV  3.61        0.54 17            16 0 55.04  1.1 17  1  1  1.1   1.1                           1900
|
Virginia:
Annandale
- Lowell notes:
"
October was dry and slightly cooler than average with a monthly mean
temperature of 55.7� a -0.3� departure. The total precipitation was 1.38"
the least since 2001 and a - 2.00" departure. In the last 24-years, only
three Octobers have been drier. However eleven days had measurable rain.
In the last 24-years only four Octobers have had more days of measurable rain.
This dichotomy plus the fact that 70% of the rainfall occurred from the 15th - 31st
gave the impression that it wasn't a dry month.
October's average cloud cover was less than September but was still the
third cloudiest October in the last 24-years with October 2002 holding the
record for the cloudiest. The temperature range on the 20th was only 1�
during the day and set a new 24 year record as the lowest temperature range
recorded at this station in October. The old record was 3� in 2002. It is
also the first time in the last 24 years to have a 1� daily temperature
range for any of the months of the year. The average daily temperature
range was only 14.9� and was the second lowest ever recorded for October.
The lowest was 13.0� in 2002.
The average daily maximum temperature had a departure of -1.8� and
the average minimum daily temperature had a departure of +1.1�. The
higher than average cloud cover and humidity of October made the
nights warmer and the days cooler which was also true of September.
The maximum wind gust of 24 mph occurred on three dates the 16th,
17th, 31st and October had the least total wind run (605 miles)
since I started keeping this data for the last three years.
The lowest barometer was 29.38"on the 15th and that was the lowest barometer
recorded in October since October 1980 except for last year which was 0.01"
lower on the same date. The 30.48" recorded on the 6th and 7th was the
highest barometer in October since 2001 when 30.69" was recorded.
8 daily records were tied or broken (24 years of records:
1 HIGH maximum temperature: 31;
2 LOW maximum temperature: 21, 24;
2 daily HIGH minimum temperature: 30, 31 and
3 daily LOW range temperature: 20, 21, 29.
" [ - - ]
Arlington
- NWS LWX's Strong reports:
"
NO NEW RECORDS WERE SET IN WASHINGTON IN OCTOBER 2004.
OCTOBER 2004 WAS A BIT DRIER THAN NORMAL...BUT WAS OTHERWISE AN
UNREMARKABLE MONTH. IT WAS NEAR NORMAL IN TERMS OF TEMPERATURE AND
JUST OVER HALF OF THE AVERAGE OCTOBER RAINFALL.
DAYTIME TEMPERATURES TYPICALLY IN THE 70S EARLY IN THE MONTH...FELL
INTO THE 50S AND 60S FOR MUCH OF THE FINAL TWO THIRDS OF THE MONTH.
MOSTLY SUNNY SKIES WERE MORE COMMON IN THE FIRST WEEK OF THE
MONTH...WHILE NINE OF THE FINAL THIRTEEN DAYS WERE GENERALLY CLOUDY.
AN END OF MONTH WARM SPELL BROUGHT TEMPERATURES INTO THE 70S FOR THE
FINAL TWO DAYS OF THE MONTH. ODDLY HALLOWEEN WAS THE WARMEST DAY OF
THE MONTH AT 79 DEGREES WITH PARTLY SUNNY SKIES.
" - [ - - ] "
Bridgewater
- "
Rainfall for the month was 1.3" below normal. However, the
precipitation for the year is still above normal. 3.11" above in
Bridgewater. The temperature was 3.2� above normal. The barometer
reading of 29.41" on the 15th was the lowest that I have seen for a long
time. There were no thunderstorms during the month.
" - [ + - ]
Centreville
- "
Perspiring ghosts, goblins, and trick or treat monsters of all ages were
about as much excitement as we could muster for an otherwise uneventful
October. The monthly mean temperature of 57.1� came in at 2.2� above the
normal 54.9�, and a Happy Halloween max. of 78� was a mere 3� shy of the
1996 record of 81�. Many of the Marine Corps Marathon runners felt the
heat on the 31st as well. With an ideal marathon temperature of 68�, the
more than 16,000 starters kept the ice detail on the sidelines locked
in high gear for much of the day. Our lowest of the low was logged on the
19th with 37�, but that was nearly double the 19� recorded as a record,
and also done in 1996. The nightly average low of 49.3� was an even 8�
over the 41.3� normal, and the third warmest average low of the year.
Our rain gauges, I'm sure, felt spooked by the lack of precipitation
for the first half of the month. Only 0.05" accumulated during that
period. Eighty-five percent of our total monthly rainfall during the
third week of October though, and that helped put to rest the fears of
fires brought on by the apparent dryness from earlier in the month.
We enjoyed the sudden burst of rain, however, but our monthly rain
total fell miserably short with 1.30", or slightly over a third of our
3.62" quota being recorded for the month. For the year, this shortage
has put us back in the hole, but by just 2.07". Happy Thanksgiving
everyone!
" - notes from Paul [ + - ]
Falls Church
- "
" - notes from Erica [ M + ]
Herndon
- Russ send these notes:"
October temperatures averaged close to normal. Rainfall was
much below average. The monthly temperature was 0.2�
below average and precipitation was 2.11" below average.
It was a relatively dry, uneventful weather month, with just a
rumble of thunder on the 15th and gusty winds on the 16th.
" - [ - - ]
Herndon
- Bob notes:"
My average MAX temperature was 4.5 degrees BELOW the Dulles
"normal" and the average MIN was 5.0 degrees ABOVE. Calendar year precip is
about equal to the Dulles "normal." Very dry month but not as bad as October
2000 when only 0.15 was observed. Dulles is 4 miles WSW and its "normal"
is based on the 1971-2000 average.
" - [ + - ]
Lexington
- notes from Scott:
"
Scott has left WREL in Lexington and now is focusing his attention on his new
web site, Mid-Atlantic Wxr.com found at http://www.midatlanticwx.com/.
Here you can still find his popular hurricane model map as well as local conditions - and more -for
Lexington.
"
Portsmouth
- "
Station record for October:
31ST - TEMPERATURE - MAXIMUM 80� [PREVIOUSLY 79� IN 1994].
For the month, rainfall was only 58% of the normal 2.07". The average temperature
was 6/10ths degree below normal. While the high daytime average was 2�� below normal- onshore flow (132� avg)
much of the month - the average minimum temp was above normal. Rather unusual for
the month, the max temp occurred on Halloween and was a record. Usually worry about the
first frost occurring on the Halloween pumpkin at this site. Still no frost
through month's end. Only one day with dense fog, the second occurrence of the
year.
For the year, rainfall was 1.67" above normal (104%) and the annual temp average was
0.2� above normal. The max temps avg for the year is running below normal while
the min temp is running above normal."
- [ - - ]
Roanoke
- Wendell notes:"
A cloudy, rainy month noted here. We had rainfall on 15 days but not a lot of
rainfall on most of those days. The total of 2.51" was 1.51" below normal.
Temperatures averaged 2.5� above normal. A very mild month.
" - [ + - ]
Ruther Glen
- Danny notes:
"
A paltry precipitation total follows two months that featured
copious amounts of rainfall. Two 79� days capped off an otherwise
normal temperature month. Temperatures finished very slightly below normal
for the second straight month.
" - [ - - ]
North
Carolina:
Raleigh
-
October was a mild month with the average daily temperature 1.6� above normal.
There was scattered frost on the 17th, but no freezing temperatures were
recorded. Precipitation for October was below normal (no tropical systems
affected the region) with 73% (1.56") of the monthly total occurred on the
13th. There were also 5 days that were solid overcast during the daylight
hours. No severe weather during the month but several tornado warnings
were issued on the 13th
- [ + - ]
Raleigh
- NWS Raleigh (RAH) reports:
Here are excerpts from the October climate summary from NWS RAH:
"
The full October 2004 NC Weather Review is available at:
http://www.erh.noaa.gov/rah/climate/data/MonthlySummary.Oct.2004.doc.
" -
South
Carolina:
North Myrthle Beach
-
A record high temperature tied on the 31st (85�) and previously set in 1950.
- [ + - ]
Nearby
Cities:
Tri-Cities
-
"
The average monthly temperature at Tri-Cities was 60.5�, which was 5.5�
above normal. It ranked as the 11th warmest October on record at Tri-Cities.
No daily records were broken. The warmest October at Tri-Cities was back in
1984, when the average temperature was 63.6�.
Tri-Cities received 3.35" of rain in October, which was 1.05" above normal.
It ranked as the 14th wettest October on record at Tri-Cities. Measurable
rain occurred on 11 days, and three of those days had more than �inch. The
heaviest rain fell on the 19th when 0.91" was recorded, which broke the
old daily rainfall record of 0.87" set in 1968. The wettest October at
Tri-Cities was back in 1959, when 5.65" fell."
- from NWS MRX [ + + ]
COLUMN
DENOTATIONS:
| A maximum mean temperature |
T total precipitation (inches)
T1 departure from normal |
| B minimum mean temperature |
U maximum calendar day precipitation
(inches) |
C monthly mean temperature
C1 departure from normal |
U1 date of maximum calendar day precipitation |
| D maximum temperature |
V date(s) of maximum daily precipitation |
| E date(s) of maximum temperature |
V1 maximum 24-hour precip. &
date(s) |
| F minimum temperature |
W number of days with precip. >=
.01" |
| G date(s) of minimum temperature |
X number of days with precip. >=
1.0" |
| H days with maximum temperature
>=90 |
Y year-to-date precipitation (inches) |
| I days with maximum temperature
<=32 |
Z maximum calendar day snowfall (inches) |
| J days with minimum temperature
<=32 |
|
| K days with minimum temperature
<= 0 |
1 date of maximum calendar day snowfall (inches)
|
| K1 average relative humidity |
2 number of days with snowfall |
| L peak wind gust (miles per
hour) |
3 number of days with snowfall >=
1.0" |
| M direction of peak wind gust |
4 total snowfall for month
(inches) |
| N date(s) of peak wind gust |
5 total snowfall for 2004-2005 season
(inches) |
| N1 average wind speed (miles per hour) |
6 maximum barometric pressure (inches) |
| N2 dominant wind direction |
6A date of maximum barometric pressure |
| O number of days with thunder |
7 minimum barometric pressure (inches) |
| P number of days with hail |
7A date of minimum barometric pressure |
| Q number of days with glaze |
8 average sea-level pressure |
| R number of days with ice pellets |
|
| R2 sky cover percentage |
NR not recorded |
| R1 number of days with dense fog
[1/4 mile and less visibility] |
(i) incomplete data |
| S local observation time for
temps/precipitation |
(M) missing, if listed in data table |
| ~ "about" |
E estimated |
| + additional indeterminate
number of days |
CWA - NWS Office County Warning Area |

For ACON
VA/NC/SC Recent Weather News, Search CNN
http://www.cnn.com/WEATHER
National
Weather Service Web Sites & Current Email Addresses
Within or
Nearby the ACON VA/NC/SC Area Can Be Found At:
NWS Washington/Baltimore,
VA/MD
NWS Wakefield, VA
NWS Blacksburg, VA
NWS Raleigh, NC
NWS Newport/Morehead City, NC
NWS Wilmington, NC
NWS Greenville-Spartanburg, SC
NWS Columbia, SC
NWS Charleston, SC
NWS Morristown, TN
National Weather Service
Homepages
$$$ National Climatic Data
Center, Asheville, NC $$$
STATION
/ LOCATION (MILES & DIRECTION FROM MAIN POST OFFICE)/OBSERVER / YEAR
RECORDS BEGAN / EMAIL ADDRESS:
| |
ROK Roanoke, VA 6SW Wendell
Prillaman 4/76 wlprillaman@cox.net |
| ANN Annandale,
VA 1 3/4 ENE - Lowell Koontz 8/31/79 wwkoontz@verizon.net |
AKQ Wakefield,
VA NWS Wakefield Municipal Airport 36-58-53N 077-00-04W 33M |
| DCA Arlington,
VA Washington, DC, Reagan Washington National Airport 38-50-54N 077-02-03W
18M |
WSH Washington, VA
David Yowell runamok@runamok.com |
| BCB Blacksburg,
VA NWS Virginia Tech Airport 37-13N 080-25W |
WEE Weems, VA 3WNW Francis
J. Socey |
| BRI Bridgewater,
VA Clayton Towers Ctowers@rica.net |
WOO Woodstock, VA 5NW Lauck
Walton - 12/1/85 jwalton@shentel.net |
|
CEN Centreville, VA Paul
Bassett 1985 m.psb@verizon.net
|
Ruther Glen, VA 38�0'45" N
77�32'29" W Danny
Jessee 2003 danny@dannyjessee.com
|
|
|
WAL Wallops Island, VA
37� 56'26" N
75� 27'47" W Wallops Flight Facility Airport
|
| CHO Charlottesville,
VA Charlottesville-Albemarle Airport ASOS (Rappahannock County)
38-08-18N 078-27-21W 192M |
AVL Asheville,
NC Asheville Regional Airport 35-25-55N 082-32-15W 670M |
| |
MRH Beaufort,
NC Michael J. Field Airport 34-44-01N 076-39-38W 3M |
| DAN Danville, VA, Danville
Regional Airport, 36-34-22N 079-20-10W 175M |
BRE Brevard, NC
1SE Bob Keehn 1/1/90 rkeehn@brinet.com |
| IAD Dulles - Washington-Dulles
International Airport 38-56-05N 077-26-51W 93M |
CLT Charlotte,
NC NWS Charlotte/Douglas International Airpot 35-12-48N 080-56-55W 220M |
| FCH Falls Church,
VA Erica Page - 3/7/94 Windie1970@aol.com |
HKY Hickory, NC |
| HAM Hampton, VA
5NE Dave Kessel 1989 davidckessel@cox.net |
ECG Elizabeth City, NC,
Coast Guard Air Station 36-15-47N 076-10-58W 11M |
| CTR Chesterfield, VA Albert Arnold 06/03 |
FAY Fayetteville, NC Fayetteville
Regional Airport, 34-59-22N 078-52-48W 55M |
| HER Herndon, VA
R.M. Beall P- 10/76 T- 1/91 beall47@earthlink.net |
GSO Greensboro, NC NWS
Piedmont Triad International Airport 36-05-51N 079-56-37W 275M |
| |
HSE Cape Hatteras,
NC Mitchell Field 35-13-56N 075-27-21W 3M |
| HRN Herndon, VA 4SW Russ
Topping - 1985 weatherwatcher@cox.net |
LBT Lumberton,
NC Lumberton Municipal Airport 34-36-26N 079-03-36W 37M |
| |
EWN New Bern,
NC Craven County Regional Airport 36-04-03N 077-02-50W 3M |
| LXI Lexington,
VA Scott M. Lancey, WREL Radio - 06/96 weather@wrel.com |
RAL Raleigh, NC
7NNW Bob Woodson - 6/1/93 kf4mmm@qsl.net |
| LKU Louisa,
VA 1N Joseph Bowers 1944 - NWS ID 44-5050-02jmbiii@earthlink.net |
RDU Raleigh-Durham, NC
Raleigh-Durham International Airport 35-52-14N 078-47-11W 130M |
| LOU Louisa,
VA 6S John Bullock (about 1970) INACTIVE 1/1/02 |
ROX Roxboro, NC
2SE Merriell A. Jay 1/93 |
| LYH Lynchburg,
VA NWS Lynchburg Regional Airport 37-19-15N 079-12-24W 295M |
ILM Wilmington,
NC NWS New Hanover International Airport 34-16-06N 077-54-22W 9M |
| NEW Newmarket,
VA 2W Joyce Winfree joywood@shentel.net |
CHS Charleston, SC NWS
Charleston Air Force Base 32-53-56N 080-02-26W 13M |
| NPN Newport
News, VA 7N Gary Leonard - 6/91 GaryMLeonard@aol.com |
CAE Columbia, SC
NWS Columbia Metropolitan Airport 33-56-31N 081-07-05W 73M |
| NOR Norfolk,
VA 3NE Jim Fentress 6/1/77 |
FLO Florence, SC
Florence Regional Airport 34-11-16N 079-43-51W 44M |
| ORF Norfolk,
VA 5NE 36-54-13N 076-11-31W 14M 1871 |
GSP Greenville-Spartanburg,
SC NWS Greenville-Spartanburg Airport 34-53-02N 082-13-15W 286M |
| POR Portsmouth,
VA 36.81° North 76.33° West 3S Bill Trotter - 7/1/76 wxr@cox.net |
CRE North Myrtle
Beach, SC Grand Strand Airport 33-48-42N 078-43-26W 10M |
| MEC Mechanicsville,
VA Glen Martin 11/19/91 |
OGB Orangeburg, SC
Orangeburg Municipal Airport 33-27-50N 080-51-13W 59M |
| FHC Norfolk, VA Fred
Heutte Center 36° 54'N 76° 16'W 01/01/03 fhcgarden@cox.net |
AND Anderson, SC |
| RIC Richmond,
VA Richmond International Airport 37-30-40N 077-19-24W 50M |
TRI Tri-cities,
TN (Bristol / Johnson / Kingsport), Tri-City Regional Airport 36-28-47N
082-23-56W 474M |
| ROA Roanoke, VA
Roanoke Regional Airport 37-19-01N 079-58-27W 362M |
DAV Davis, WV Dave Lesher wvweather@mountain.net |
|