ACON - VA/NC/SC
The Atlantic Coast Observer Network:   Virginia, North Carolina, South Carolina
http://members.cox.net/wxr/acon.htm

SUMMARY OF CLIMATOLOGICAL DATA 
SEPTEMBER 2003

...DESTRUCTIVE HURRICANE ISABEL WREAKS HAVOC THROUGHOUT MUCH OF THE REGION...
September 17-20th, 2003

Click image for enlarged picture          Click image for Track of Hurricane Isabel

No question as to the weather story of the month! Hurricane Isabel roared into the southern North Carolina coast late on the 17th and moved through the region on the 18th and 19th. Clearly from your reports, greatest rainfall amounts and wind speeds predictably occurred to the north and east E of the track. Many of you have commented that, to the effect, never before have we seen the professionals do such a superb job with the forecasting of a hurricane. And the watches and warnings, days in advance, helped many prepare for the ensuing devastation across the region. Hardest hit clearly were the coastal and inland areas in Eastern North Carolina and Southeastern Virginia. As Isabel was a large storm, all of us were affected in one way or another. Very strong, damaging winds, high storm surges with heavy beach erosion, torrential rains and tidal flooding were widespread. Isolated tornadoes were observed on radar. Extensive tree damage was seen, but not limited, to the north and east of the storm's path resulting in considerable damage to homes. Beach erosion and storm surges washed away homes. Power was lost by up to 90% of electricity consumers residing where the upper right quadrant of the storm passed. Power was out for days and in many cases up to two weeks! And, sadly, as has come to be expected with such storms, lives were lost. And human bonds were strengthened as those affected worked to recover from such a storm unseen in decades.

Member Dave Kessel of Hampton noted that his mother stated that this storm was comparable to the 1933 Hurricane and Hurricane Hazel in 1954 and, in some regards, the storm was worse because of our higher reliance on technology in our daily lives and the loss of it. Mrs. Kessel's noteworthy observation helps us have a clearer understanding of the magnitude of this storm.

Perhaps the best summaries compiled of the data collected during the event are found at the National Weather Service websites, for which links are provided at the bottom of this page. We believe that NWS Wakefield (AKQ) has an excellent post storm summary and a link is provided by clicking here.

  • New Snowfall Season Begins: With the trace of ice pellets reported by Dave Lesher (DAV) in Davis, West Virginia, during September our seasonal snowfall totals now begin anew. Please adjust your forms to begin new totals (monthly and seasonal). (If this troughing over the east continues, we could see some high totals once again this winter!)
  • The Weather Underground: Here's something to keep in mind if you're using the Weather Underground website to post data. The WU only posts your hourly readings, if received. Unfortunately, they are posting a daily and a monthly summary based on the obs at the time you transmit your data. As a result, their software is calculating your daily and monthly summaries based on periodic obs, not real-time data from your data logger. This will usually skew the summary data they post and visitors to the site may not get a true accounting of your readings.
  • National Digital Forecast Database (NDFD) Experimental Forecast & Data Images: The NWS Wakefield, among other local NWS webpage sites, has a fantastic new and experimental graphical subpage of public and marine digital forecasts. Parameters include, among others, temperature, dew point, probability of precipitation, sky cover, wind direction and speed, as well as rainfall QPF. We think you'll really enjoy these new visual aids with mouse-over effect while making your daily weather forecasts. Check this feature out at the NWS Wakefield website from which you can locate adjacent sites with such displays.

  • REMINDER: All National Weather Service station data listed herein is preliminary and may be subject to change.  The data has not been certified and cannot be used in legal actions.  Only reports certified by the National Climatic Data Center in Asheville, NC may be used for these purposes.
ACON VA/NC/SC Member Station Extremes - SEPTEMBER 2003
State
Maximum Temperature
Minimum
Temperature
Warmest
Average
Temperature
Coldest
Average
Temperature
Maximum
Precipitation
Minimum
Precipitation
Virginia
94°
Hampton, Norfolk (ORF)
34°
Blacksburg
74.1°
Norfolk (ORF)
62.9°
Blacksburg
14.10"
Hampton
4.03"
Blacksburg
North Carolina
97°
Charlotte
38°
Asheville
75.1°
Cape Hatteras
65.2°
Asheville
7.90"
Greensboro
2.41"
Hickory
South Carolina
92°
Florence
43°
Columbia
75.2°
North Myrtle Beach
70.7°
Greenville-Spartanburg
4.46"
Charleston
0.85"
Florence

(Please note the column denotations table below.)
TEMPERATURE / WINDS/ ELEMENTS

VIRGINIA
[Reminder: All NWS DATA HEREIN IS NOT OFFICIAL]
STN  A      B    C      C1    D      E F     G    H I  J K L  M     N  O P Q R R1 S
------------------------------------------------------------------------------ 
AHB 77.6  58.5  68.1        87.2   1 41.1 30   0  0  0 0 26 ESE  18  3 0 0 0  5 2400
ANN 74.80 60.53 67.67  0.00 85     1 44   30   0  0  0 0 41 NE   18  4 0 0 0  0 2400
BCB 73.8  52.1  62.9  -0.1  84   1,2 34   30   0  0  0 0 30 320° 18  1 0 0 0  7 2400 
BRI 75.7  57    66.4        89     1 39   30   0  0  0 0             3 0 0 0  0 2400
CEN 77.2  60.8  69.0  +2.5  86     1 43   30   0  0  0 0 45 089° 18  6 0 0 0  0 2400
CHO 76.0  56.6  66.3  -2.9  87   1,2 37   30   0  0  0 0 46 010° 18  3 0 0 0 11 2400 
DAN 78.1  58.0  68.1        87   1,2 39   30   0  0  0 0                        2400 
CTR 79.5  54.2  68.9        91.6   2 41.8 30   1  0  0 0 36 NNE  18  2          2400 
DCA 77.8  63.1  70.4  -0.1  85  1,20 49   30   0  0  0 0 58 130° 18  4 0 0 0  0 2400 
IAD 76.3  57.9  67.1  -0.2  86     1 40   30   0  0  0 0 48 090° 18  6 0 0 0  2 2400 
FCH 77.1  61.3  69.2        88    27 48   30   0  0  0 0 70      18  4 0 0 0  0 2400 
HAM 81.3  66.2  73.8        94     2 51   30   2  0  0 0 92 ESE  18  2 0 0 0  0 2400 
HER 74.7  59.0  66.8  -0.5  84.9   1 42.6 30   0  0  0 0 32      19  4 0 0 0    2400 
HRN 75.5  59.0  67.0  -0.3  85.2   1 41.7 30   0  0  0 0 47 E    19  2 0 0 0  0 2400 
LKU 77.9  55.3  66.6  -1.3  89     2 37   30   0  0  0 0 63 SW   19  0 0 0 0  0 2400 
LYH 75.9  56.1  66.0  -1.1  88     2 36   30   0  0  0 0 35 320° 18  3 0 0 0  6 2400 
NEW 75.20 55.56 65.38       89     1 37   30   0  0  0 0 43 S    18  0 0 0 0  0 2400  
NPN 80.8  63.0  71.9        91     2 46   30   2  0  0 0 61 E    18  4 0 0 0  1 2400 
NOR 80.6  65.3  72.9  +1.4  92     2 51   30   4  0  0 0             2 0 0 0  0 2400 
ORF 80.6  67.5  74.1  +2.0  94     2 53   30   4  0  0 0 74 110° 18  4 0 0 0  2 2400 
FHC 79.91 66.49 73.2        90.3   2 55.6 30   2  0  0 0 70 NNE° 18             2400 
POR 80.0  65.3  72.6  +0.1  89     2 53   30   0  0  0 0 70 068° 18  4 0 0 0  1 2400 
MEC 84    61    73          92  1,21 43   30   2  0  0 0             2 0 0 0  0 1700 
RIC 79.0  61.0  70.0  +0.2  89   2,3 45   30   0  0  0 0 72 100° 18  2 0 0 0  3 2400 
ROA 76.1  57.3  66.7  +1.0  90     2 41   30   1  0  0 0 44 350° 18  3 0 0 0  1 2400 
ROK 77.4  56.5  67.0  -0.6  90     2 38   30,  1  0  0 0 23 NW   19  2 0 0 0  1 2230 
AKQ 81.0  61.0  71.0        90   1,2 42   30   2  0  0 0                        2400 
WEE 77.7  58.2  67.95       90     1 50   11  11  1  0 0 72 NE   18  2 0 0 0  0 1630
WOO 72.4  58.5  65.4        84     1 42   20   0  0  0 0             1 0 0 0  5 0800 
WSH 73.0  57.6  65.3        81.2   1 41.7 30   0  0  0 0 41 W    18  4 0 0 0  0 2400
NORTH CAROLINA
[Reminder: All NWS DATA HEREIN IS NOT OFFICIAL]
STN  A      B    C      C1    D      E F    G     H I  J K L  M     N  O P Q R R1 S
------------------------------------------------------------------------------ 
AVL 75.6  54.8  65.2  -0.5  83     2 38   30   0  0  0 0 30 300° 18  1 0 0 0 13 2400
CLT 80.3  59.3  69.8  -2.9  97  3,20 42   29   0  0  0 0 32 190° 22  2 0 0 0  2 2400
ECG 80.9  65.9  73.4  +0.1  90   2,3 52   30   2  0  0 0 74 060° 18  2 0 0 0  7 2400
FAY 82.1  63.2  72.7        93   1,2 48   30   4  0  0 0 58 310° 18  4 0 0 0  7 2400
GSO 77.7  59.8  68.8  -1.0  87     4 44   30   0  0  0 0 46 310° 18  4 0 0 0  1 2400
HKY 77.9  58.4  68.2  -1.7  84 13,20 42   30   0  0  0 0 28 300° 18  3 0 0 0  7 2400
HSE             75.1  -0.4                                                      2400
LBT 81.8  62.6  72.2  +0.1         4 47   30   4  0  0 0 52 300° 18  3 0 0 0  8 2400
RAL 80.0  59.1  69.5        89   2,3 40   30  10  0  0 0 39      18  1 0 0 0  1 2400
RDU 79.4  60.3  69.9  -1.3  89     3 43   30   0  0  0 0 45 290° 18  1 0 0 0  5 2400
ROX 78.5  59.6  69.1        90     3 40   30   1  0  0 0 63 NW   18  2 0 0 0  1 2100
ILM 81.4  64.4  72.9  -2.2  89     2 48   30   0  0  0 0 59 260° 18  3 0 0 0  5 2400
SOUTH CAROLINA
[Reminder: All NWS DATA HEREIN IS NOT OFFICIAL]
STN  A      B    C      C1    D      E F    G     H I  J K L  M     N  O P Q R R1 S
-----------------------------------------------------------------------------
AND 82.2  61.0  71.6  -0.6  89    20 44    29  0  0  0 0 32 200° 22  2 0 0 0  2 2400
                                                         32 310° 27
CAE 82.8  62.9  72.9  -1.8  91   1,4 43    30  2  0  0 0 36 260°  4  2 0 0 0  4 2400
CHS 83.1  66.0  74.6  -1.5  89   2,3 51    30  0  0  0 0 38 160°  1  4 0 0 0  0 2400
CRE 83.5  66.9  75.2  +1.0  90   3,4 48    30  4  0  0 0 33 290° 18  0 0 0 0  5 2400
FLO 83.2  62.9  73.0  -1.6  92   3,4 47    30  4  0  0 0 38 290° 18  1 0 0 0  6 2400
GSP 80.6  60.8  70.7  -0.7  88     3 45    30  0  0  0 0 42 280°  4  4 0 0 0  2 2400
OGB 83.1  63.3  73.2        91     1 46    30  2  0  0 0 28 300° 18  0 0 0 0  6 2400
NEARBY STATIONS
[Reminder: All NWS DATA HEREIN IS NOT OFFICIAL]
STN  A      B    C      C1    D      E F    G    H  I  J K L  M     N  O P Q R R1 Sl
------------------------------------------------------------------------------
TRI 77.2  54.5  65.8  -0.8  86     1  39   29  0  0  0 0             2 0 0 0  9 2400
DAV 63    51    57          72     3  36   30  0  0  0 0             1 0 0 1  2 1900

(Please note the column denotations table below.)
PRECIPITATION / BAROMETRIC PRESSURE

VIRGINIA
[Reminder: All NWS DATA HEREIN IS NOT OFFICIAL]
STN  T      T1     U       V      V1   W X   Y      Z  1  2 3    4    5      6       7        S 
----------------------------------------------------------------------------------------- 
AHB  7.41        1.76 23 2.80 22-23 14 3                               30.30  30 29.43  19 2400
ANN  7.80  +3.72 2.59 23 3.31 18-19 13 2 50.44  0.0          0.0  0.0  30.31  30 29.46  19 2400
BCB  4.03  +0.64 1.06 22 1.06    22 11 1 44.87  0.0          0.0  0.0                      2400
BRI  8.94        3.00 18 4.21 18-19 11 2 45.75  0.0          0.0  0.0  30.27  29.77        0515/1600
CEN  8.17  +4.18 2.66 18 2.89 18-19 13 3 51.91  0.0          0.0  0.0  30.31  30 29.48  18 2400
CHO  5.69  +0.84 1.77  2 1.90   1-2 12 1 48.37  0.0          0.0  0.0                      2400
DAN  8.09        2.83 23            13 4        0.0          0.0  0.0  30.33  30 29.24  18 2400
CTR  7.46        3.42 18 3.42    18  7 3 44.05  0.0          0.0       30.268 30 29.084 18 2400
DCA  6.87  +3.08 2.28 18 2.45 22-23 13 2 48.35  0.0          0.0  0.0                      2400
IAD  7.27  +3.45 1.76 18 2.50 22-23 14 2 50.19  0.0          0.0  0.0                      2400
FCH  6.53        1.97 18 2.20 18-19 11 2 42.56  0.0          0.0  0.0                      2400
                      23
HAM 14.10        4.50 4, 5.30   3-4  4 7 59.65                                             2400
                      18                      
HER  7.47  +3.65 2.07 23 2.45 22-23 15 2 51.36  0.0          0.0  0.0  30.28  21 29.37  19 2400
HRN  7.21  +3.39 2.16 18 2.34 18-19 14 2 58.98  0.0          0.0  0.0  30.281 30 29.463 19 2400
LKU 10.26  +6.45 4.91 18 5.36 18-19 16 3 54.70  0.0          0.0  0.0  30.31     29.23     2400
LYH  7.13  +3.25 3.92 18 3.94 18-19 11 2 49.69  0.0          0.0  0.0  30.35  10 29.18  18 2400
NEW  7.33        4.30 19            10 1 38.33  0.0          0.0  0.0                      1700
NPN  9.69        3.75 18 3.76 17-18 13 3 54.73  0.0          0.0  0.0  30.28  30 29.21  18 2400
NOR  9.75  +5.09 4.02 18            10 3 55.78  0.0          0.0  0.0                      2400
ORF  9.54  +5.48 4.02 18 4.02    18  8 3 52.59  0.0          0.0  0.0  30.30  30 29.63  18 2400
FHC 12.86        4.86 18 4.87 18-19 12 3 56.91  0.0          0.0  0.0  30.324 30 29.236 18 2400
POR  9.71  +4.89 4.05 18 4.08 18-19 11 3 53.72  0.0          0.0  0.0  30.290 30 29.150 18 2400
MEC 11.14        2.62 18 4.22 18-19 10 3 64.19  0.0          0.0  0.0  30.08   5 29.26  18 1700
RIC 10.12  +6.14 4.32 18 4.32 18-19  7 3 53.19  0.0          0.0  0.0  30.34  30 29.20  18 2400
ROA  4.32  +0.84 1.49 18 1.50 18-19 11 1 49.81  0.0          0.0  0.0  30.35  30 29.33  18 2400
ROK  5.39  +1.19 1.63 18 1.63    18 10 2 53.06  0.0          0.0  0.0  30.33  30 29.40  19 2400
AKQ 11.11        5.66 18            13 2 55.41  0.0          0.0  0.0                      2400
WEE 11.58        3.00  4 3.00     4 11 4 54.46  0.0          0.0       30.30   1 29.32  19 2130
WOO  5.41                2.33 18-19 14 1 40.01  0.0          0.0  0.0 *31.04  21 30.44  19 0800
                                                    *barometer not calibrated / note range only
WSH 10.51        2.91 18 3.78 18-19 15 3 49.27  0.0          0.0  0.0  30.30  16 29.40  19 2400
                                                                              30
NORTH CAROLINA
[Reminder: All NWS DATA HEREIN IS NOT OFFICIAL]
STN  T     U       V      V1   W X   Y     Z   1  2 3  4     5       6       7        S
----------------------------------------------------------------------------------------- 
AVL  3.01  -0.71 2.12 22 2.12    22  7 1        0.0          0.0  0.0  30.36  30 29.74  18 2400
CLT  2.69  -1.14 1.48 22 1.54 22-23  7 1 57.96  0.0          0.0  0.0  30.35  30 29.63  18 2400
ECG  7.58  +2.51 2.72 18 2.77 17-18 12 2 37.15  0.0          0.0  0.0  30.30  30 28.96  18 2400
FAY  3.33        1.35 18 1.35    18  8 1 47.82  0.0          0.0  0.0  30.30  30 29.32  18 2400
GSO  7.90  +3.60 2.28 18 3.67 22-23  7 3 56.21  0.0          0.0  0.0                      2400
HKY  2.41  -1.83 1.08 22 1.08    22  6 1        0.0          0.0  0.0  30.32  30 29.59  18 2400
HSE  3.94  +1.42                                                                           2400
LBT  6.31  +1.70 3.39 18 3.39    18  9 1 48.30  0.0          0.0  0.0  30.30  30 29.62  18 2400
RAL  4.10                1.61 17-18 17 0 40.36  0.0          0.0  0.0  30.27  26 28.93  18 1900
RDU  4.47  +0.21         1.62 18-19  8 1 41.88  0.0          0.0  0.0  30.34  30 29.16  18 2400
ROX  6.41 ~+3.00 2.87 18 2.87    18 11 3 58.94  0.0          0.0  0.0  30.30  30 29.11  18 2100
ILM  5.75  -1.04 1.98 18 1.98    18 12 2 47.16  0.0          0.0  0.0  30.28  30 29.25  18 2400
SOUTH CAROLINA
[Reminder: All NWS DATA HEREIN IS NOT OFFICIAL]
STN  T      T1     U       V      V1   W X   Y     Z   1  2 3  4     5       6       7        S
----------------------------------------------------------------------------------------- 
AND  1.71  -2.48 1.23 22 1.23    22  6 1        0.0          0.0  0.0  30.33  30 29.75  18 2400
CAE  4.28  +0.34 1.70  4             9 2 49.06  0.0          0.0  0.0  30.31  30 29.70  18 2400
CHS  4.46  -1.52 1.67  6 2.16   5-6 10 2 45.27  0.0          0.0  0.0                      2400
CRE  2.37  -3.21 0.83 18            11 0 52.73  0.0          0.0  0.0  30.25  30 29.52  18 2400
FLO  0.85  -2.82 0.31  4             9 0 30.14  0.0          0.0  0.0  30.30  30 29.62  18 2400
GSP  1.72  -2.25 1.36 22 1.36    22  4 1 54.77  0.0          0.0  0.0  30.33  30 29.72  18 2400
OGB  2.71                1.05   7-8 10 0 49.53  0.0          0.0  0.0  30.30  30 29.72  18 2400
NEARBY STATIONS
[Reminder: All NWS DATA HEREIN IS NOT OFFICIAL]
STN  T      T1     U       V      V1   W X   Y     Z   1  2 3  4     5       6       7        S
------------------------------------------------------------------------------------------------
TRI  5.29  +2.21 1.25 22 1.30 14-15  8 3 54.16  0.0           0.0  0.0                      2400
DAV  8.58        3.66 19            18 3 58.18    T 29          T    T                      1900

Virginia:

Ashburn - Gary reports at his website: " The average wind speed was 0.7 mph and the dominant wind direction was SSE. The average barometric pressure was 30.045". The mean relative humidity was 82%. " 

Annandale - Lowell reports: " September started warm and ended cool giving an average monthly mean temperature but was much wetter than average with higher humidity and thirteen days with measurable rain. In the last 24-years only four Septembers have been wetter. Only 1992 and 1999 had more days with measurable rain. The record is 15 days in 1999. The 7.80" of rain for September was a +3.72" departure. Only two years in the last 23-years has the precipitation total for the year been more than the current year's total at the end of September. The 1.66" of rain that occurred in one hour on September the 23rd was the second most intense one hour rainfall ever recorded in September and the third greatest rainfall ever recorded for any month. (Rain intensity records since 1990) The 3.31" in 24-hours on the 22nd and 23rd was the most in 24-hours since Hurricane Floyd 9-16-1999. September had two 23-year precipitation records for the date and had two days with more than two inches of rain. September's average sky cover made it the fourth cloudiest September in the last 23-years and the cloudiest since 1993 although 2000 was close. September's mean average temperature was 67.7°F which was exactly average. The maximum temperature for September was 85° which was a -3.7° departure. (The highest temperature for the year was only 94° on July 5th. This is the lowest maximum for the year since 1989 when 94° also occurred and is also the first time since 1989 we have gone without a 95° day here for the year.) September's average temperature range was only 13.9° the least in the last 23-years due to the cloudiness and humid conditions of this September. The greatest daily temperature range for the September was only 21° which tied the 23-year record of 1992 for the lowest maximum daily temperature range. The maximum wind gust of 41 mph from the NE occurred on the 18th at 1603 in Hurricane Isabel and was the highest wind ever recorded here in the last 23 years in the month of September. The lowest barometer was 29.46" on the 19th which was the lowest barometer recorded in September since 1999 and the pressure has dropped below this level three times in the last 23-years. There were only 7 daily records set! September DAILY Records Tied or Broken- (23-Years of records): September had 2 daily LOW maximum temp records: 10, 12; September had 3 daily LOW range temp records: 3, 12, 14; September had 2 daily HIGH precipitation records: 18, 23. " [ +/- + ] 

Arlington - NWS WBC reports: " 2.28" OF RAIN FELL ON SEPTEMBER 18TH IN ASSOCIATION WITH ISABEL. THIS BROKE THE OLD RECORD RAINFALL FOR THE CALENDAR DAY OF 1.25" WHICH WAS SET IN 1945. SEPTEMBER 2003 WILL GO DOWN IN THE BOOKS AS A VERY ACTIVE WEATHER MONTH. THE BIGGEST STORY OF THE MONTH WAS TROPICAL STORM ISABEL...WHICH BROUGHT DAMAGING WINDS...HEAVY RAIN AND INUNDATING TIDES TO THE AREA. SEVERAL DAYS LATER DURING THE EARLY MORNING HOURS OF THE 23RD...A STRONG COLD FRONT PRODUCED ANOTHER ROUND OF FLASH FLOODS IN THE WESTERN SUBURBS. SEPTEMBER 2003 WAS THE FIFTH MONTH IN A ROW IN THE NATION'S CAPITAL THAT FEATURED ABOVE NORMAL PRECIPITATION. THE ONLY MONTH THIS YEAR WITH BELOW NORMAL TOTALS WAS APRIL. THE LAST MONTH PRIOR TO THAT WITH BELOW NORMAL RAINFALL WAS SEPTEMBER 2002. RAINFALL TOTALS SO FAR THIS YEAR THROUGH THE END OF SEPTEMBER WAS 48.35". THE NORMAL FOR THAT PERIOD IS 30.05". THE NORMAL FOR THE ENTIRE YEAR IS 39.35". THE WETTEST YEAR IN WASHINGTON WAS IN 1889. 61.33" FELL THAT YEAR. SINCE 1970... THERE HAVE BEEN 5 YEARS THAT FEATURED PRECIPITATION TOTALS OVER 50". THOSE WERE 1972 - 51.97"; 1983 - 51.87"; 1996 - 51.02"; 1975 - 50.50"; 1989 - 50.32". MEASURABLE RAIN WAS RECORDED ON 13 DAYS DURING THE MONTH. THE LONGEST PERIOD WITH NO PRECIPITATION OCCURRED FROM THE 5TH TO THE 11TH. THE HIGHEST WIND GUST DURING THE MONTH OCCURRED ON THE 18TH IN ASSOCIATION WITH ISABEL...58 MPH FROM THE SOUTHEAST. " [ - + ] 

Blacksburg - NWS Blacksburg reports the monthly mean temp was 0.1° below normal while rainfall was 0.64" above normal. The average wind speed was 3.4 MPH. [ - + ] 

Bridgewater - "The precipitation for the month was 5.24" above normal. This was the second wettest September in at least 39 years. Tropical storm from Hurricane Fran in 1996 produced more rain. The temperature for September was slightly above normal. Isabel caused a lot of damage in this area, but not as much as in other parts of the state. I don't ever recall a coastal storm causing this much wind for us here in the Shenandoah Valley. I estimated the wind at 40 to 50 miles an hour, and maybe higher in gusts. Tropical storm Fran gave us a lot more moisture, but not as much wind. It is unusal for hurricane-related storms to come directly into our area of Virginia. We have had two now in the last seven years. " - report from Clayton [ M + ] 

Centreville - " Enter Hurricane Isabel that wound up being responsible for introducing several interesting items to report for September. The highest wind gust of 45 mph out of the East on the 18th at 23:33, and the lowest barometric pressure four minutes later of 29.49" are two examples of her profound presence. Isabel also contributed 2.89" of rain on the 18th and 19th, helping to bring our year to date accumulation of 51.91" to nearly 20" over normal. With thirteen days during September registering some sort of precipitation coupled with other days displaying just plain strata-various, it is noteworthy to mention that on five afternoons the average monthly high of only 77° was recorded. Although numerous, these readings were 1.8° below the 79.0° average. While the overall monthly average temperature was just 2.5° over the 66.5° normal, the nightly low averages were once again among the highest so far this year. 60.8° this month fiddled out to be a significant 6.9° above the 59.9° normal average low. The warmest temperature during September was 86° on the 1st; the coolest was 42° on the last. Precipitation played an instrumental part in scoring this September composition as well. Disregarding Isabel's 2.89", we still came in with a rain surplus of 1.29" over the 3.99" average for a sub-total of 5.28". On September 22nd and 23rd, three days after Isabel, we picked up 2.70" in eleven hours. That accounted for 51% of our non-hurricane rainfall, and means that the 2.58" that fell during the remaining nine rainy days was actually real rain while nearly 5.6" was unreal. Happy Halloween! " - notes from Paul [ + + ] 

Charlottesville - The monthly average temperature was 2.9° below normal while rainfall was 1.14" below normal. The average wind speed was 5.9 mph. - from NWS WBC [ - - ] 

Chesterfield - - 
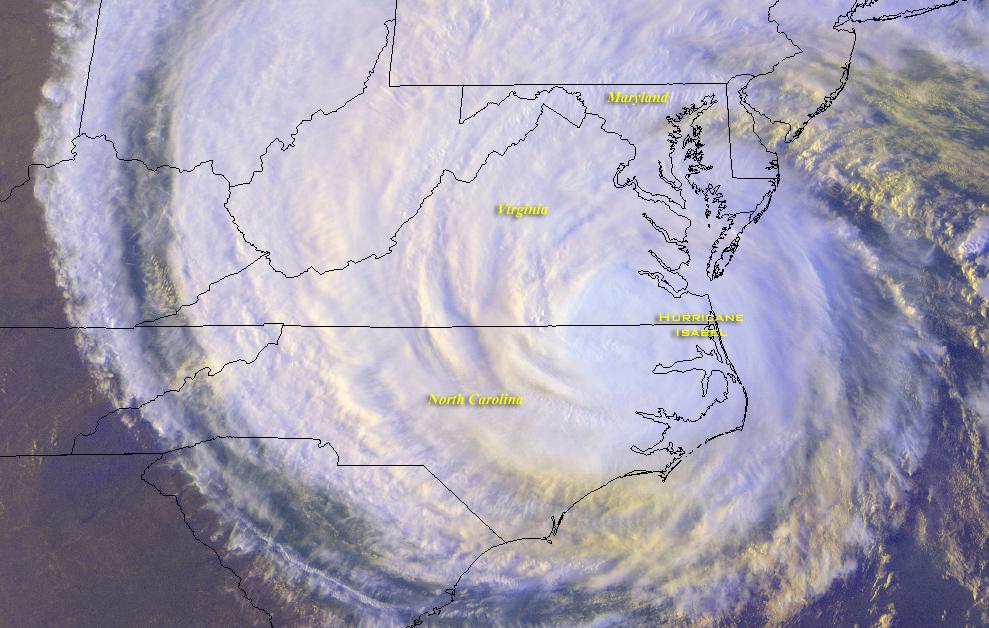
"HURRICANE ISABEL BLOWS RIGHT THROUGH RICHMOND CAUSING MAJOR DAMAGES, POWER OUTAGES, WATER ISSUES." - Albert sends this report [ M M ] 

Danville - The average station sea-level pressure was 30.05" [ M M ] 

Dulles - The mean temp was 0.2° below normal. The monthly rainfall was 3.45" above normal. Average wind speed, 6.1 mph. - from NWS WBC [ - + ] 

Falls Church - " September 2003 was a cooler and wetter than average month, a trend that has been seen a lot this year. Isabel on the 18th brought a wind gust of 70 mph around 11pm, causing an explosion in the nearby power station and I lost power as a result. I was without power from 11pm on the 18th until 6:30pm on the 20th. 43 hours!!! The longest ever for me!!!! For a brief time I also lost phone service. Isabel brought almost 2" of rain but it was the 23rd which also brought nearly 2" of rain that caused a small flood in my basement. By this time the ground had been so saturated. " - report from Erica [ - + ] 

Herndon - Russ sends these note:" The monthly temperature was 0.3° above average and precipitation was 3.39" above average. Thunderstorms rumbled through on the 1st and 3rd. The center of Isabel passed about 50 miles to our west early on the 
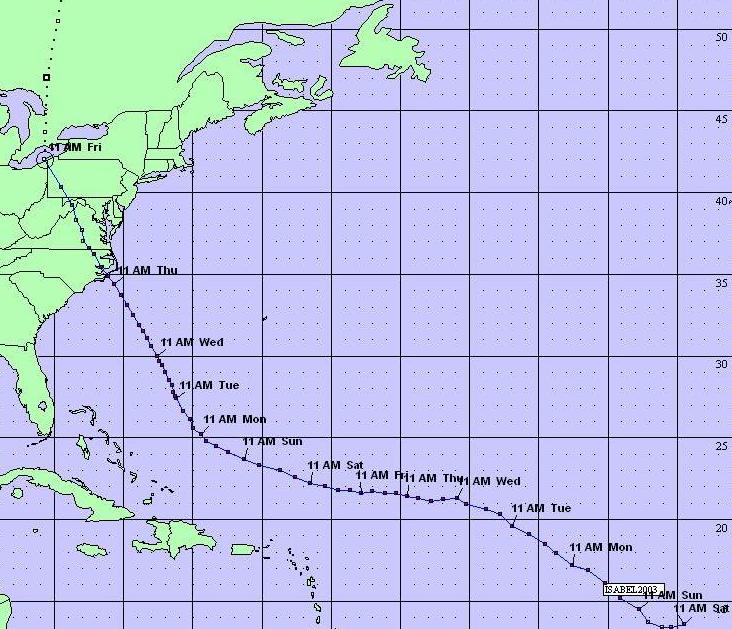
morning of the 19th, at tropical storm intensity. Isabel held category 3 or greater intensity for many days and peaked at category 5, before weakening and making landfall in North Carolina. It moved quickly to the North-Northwest, limiting rainfall over our area. Our peak wind was 47 mph, and sustained winds remained in the 20-30 mph range for most of the night on the 18-19th. This caused widespread power outages as trees toppled out of our already soaked soil. Record daily rainfall of 2.16" fell on the 18th, during Isabel. " - [ + + ] 

Herndon - Bob notes: " My average MAX temp was 4.2° below the Dulles "normal" but the average MIN was 3.4° above. Precip was almost 200% of "normal." Power was out during the lowest pressure; uncertain. Dulles is about 4 miles WSW and its normal is the 1971-2000 average. " - [ - + ] 

Hampton - " OF COURSE, THE EVENT OF THE MONTH OR FOR THAT MATTER THE LAST 150 YEARS WAS ISABEL. THE LANDFALL AND TRACK WAS THE MOST DANGEROUS FOR HAMPTON ROADS AND EASTERN VIRGINIA. RECORD SUSTAINED WINDS OF 67 MPH AND A GUST OF 92 OCCURRED AT 530PM ON 9/18. A RECORD LOW BARO PRESSURE OF 29.20 ALSO OCCURRED ON THE 18. RECORD 8 FOOT TIDE (TYING HAZEL AND ONLY THIRD TO ASH WEDNESDAY AND 1933) OCCURRED AT 3:30PM RAINFALL- DAILY RECORD OF 4.50 INCHES. POWER WAS OUT AT MY STATION FOR 9 DAYS AND IT HAS BEEN TWO WEEKS FOR PARTS OF HAMPTON. TIDAL FLOODING SPOILED MANY HOMES, SOME NOT FLOODED SINCE BEING BUILT IN THE 1960'S. OVER 4,000 HOMES WERE DAMAGED AND 60 COMMERCIAL FACILITIES WERE LOOTED. TREE AND DEBRIS REMOVAL AND REPAIRS WILL EXCEED 100 MILLION DOLLARS. MY MOTHER TALKED ABOUT HAZEL (1954) AND THE 1933 HURRICANE SHE EXPERIENCED AS A CHILD. THE DAMAGE WAS COMPARABLE TO BOTH STORMS AND IN MANY RESPECTS, MUCH WORSE DUE TO OUR RELIANCE ON TECHNOLOGY AND ELECTRIC POWER. THE ISSUES OF WATER SAFETY AND SECURITY AS WELL AS DISTRIBUTION OF SUPPLIES POST STORM NEED TO BE STUDIED CAREFULLY. " - notes from David Kessel [ M M ] 

Herndon - " The monthly temperature was 2.2° below average, precipitation was 7.23" above average. We received a record 5.18" of rain on the 19th, which fell overnight in a 3-hour period. We had thunder on the 9th, 11th, 12th, 14th, 19th, and 27th. The numbers speak for themselves. June was even wetter than May! We had numerous flood and flash flood watches and warnings." - notes from Russ [ - + ] 

Louisa - " What can I say? It was wet and windy for a bit here. I spent most of the hurricane out in it clearing trees and blocking roads that had wires down. Our firehouse and about one block around it had electricity. Never lost it! Hope all is well down in your neck of the woods." - report from Joe  

Lynchburg - Rainfall for the month was 3.25" above normal while the mean temp was 1.1° below normal. The average wind speed was 4.2 MPH. The average sea level pressure was 30.07". - from NWS Blacksburg [ - + ] 

New Market - " Our immediate area was not hit too hard from Hurricane Isabel. We were ready because they said it was following the same path as Hurricane Fran. We got wiped out on that one. This time Isabel turned more north and that saved us. We only lost power. We had , personally, moved everything we could upstairs and than waited. We are very thankful we did not get hit for the second time and so sorry for the ones who did. Mother Nature can be very hard on us mortals..." - notes from Joyce Winfree, who is celebrating her 53rd anniversary in marriage. - [ M + ]

Norfolk - NWS AKQ noted the average temperature in Norfolk was 2.0° above normal. The month's rainfall was 5.48" above normal. The average wind speed was 10.9 mph. The average relative humidity 74%." - [ + + ]

Norfolk - The Fred Heutte Center, in Historic Ghent, noted a mean barometer reading of 30.060". The mean relative humidity was 83%. The average wind speed was 5 mph from a dominant W direction. 

Portsmouth - Hurricane Isabel was the headliner. Haven't seen a storm like this in my lifetime. Storm brought strong winds to 70 mph with steady 55 mph winds on the 18th that moved a leaning 50' cedar tree to the perpendicular. Nice to have that tree straightened; but unfortunately this resulted in ground caving in under the root system and the tree had to be removed. Many neighborhood trees (oaks and pines) fell, sadly some on and through houses. Many trees were primed for falling as the year's excessive rainfall across SE VA rendered the ground saturated before the tropical system arrived. Power was out for 11 days, phone for 3, and broadband Internet/cable for 12 days! Dial-up using telephone lines allowed the station to get back "online" on the 3rd day of the event. Good test for the backup generator which worked flawlessly. Minor flooding outside the station (SE Portsmouth) but extensive flooding in northern Portsmouth, close to the harbor and the James River with 8' tidal flooding there. The Mid-town Tunnel, connecting Portsmouth with Norfolk, filled with water after flood gates failed to close, closing the span for nearly one month. Considerable political fallout resulted. Early in the event winds were from the NE but veered to the SE in mid-afternoon through early evening on the 18th. This wind shift produced the extensive damage and stronger winds. NWS reports of two tornadoes from 3 to 10 miles NE of the station. Steady rains totaling 4.08" established a new record rainfall for the 18th (4.05") and was the wettest day of the year so far. An extremely low barometer to 29.15" noted (but not as low [28.52"] as that of the March 13, 1993 low pressure moving from the Gulf of Mexico NNE along the Appalachians)- Temps were slightly above normal (+0.1°) and rainfall was 201% of the norm or +4.89" Winds averaged 3.31 mph from a dominant direction of 118°. Station daily records included: 10TH - TEMPERATURE MINIMUM MAXIMUM 73° [PREVIOUSLY 76° 1982]; 11TH - TEMPERATURE TIED MINIMUM MAXIMUM 76° [PREVIOUSLY 1995]; 12TH - PRECIPITATION 2.42" [PREVIOUSLY 0.50" 1987]; 18TH - PRECIPITATION 4.05" [PREVIOUSLY 0.33" 2000]; 18TH - WIND GUST TIED 70 MPH [PREVIOUSLY MARCH 13, 1993]; 28TH - PRECIPITATION 0.56" [PREVIOUSLY 0.43" 1997]. The average barometric pressure was 30.040". The average relative humidity was 79% and the average sky cover was 43.2%. For the year-to-date, the temperature average was 0.8° below normal while rainfall is running 15.30" above normal (140%). [ + + ] 

Richmond - NWS AKQ reported the mean temp at RIC was 0.2° above normal. Rainfall was a whopping 6.14" above normal. The average wind speed was 7.6 mph. The average relative humidity was 80% while the average sky cover was 50%. [ + + ] 

Mechanicsville - Glenn notes: " Hurricane Isabel wreaked havoc over the states of Virginia and North Carolina. My power was off for 8 days. I had trees down but luckily no damage to the house. This storm is one to remember. A tornado moved through the area on the morning of the 18th causing more damage. Very heavy rain accompanied the storm, dumping 0.94" of rain in about a thirty-minute period. " 

New Market - Joyce reports: " Temperatures and rainfall are above normal for August even with only sprinkles since the 11th of the month. Been very hot and dry since the 12th."  [ + + ]

Newport News - Gary notes:" Hurricane on the 18th left me with no power for 5 days. Damage amounted to losing my front yard shade tree. Thankfully, it fell in the street and not on the house. It came down at 4:55PM when I recorded my max. gust of 61MPH. "  [ M + ]

Roanoke - Wendell sends these notes:" Isabel was no more than a minor nor'easter here. Rainfall of 1.63" and a peak wind of 14 mph from the north on the 19th. Top wind of 23 mph from Isabel but well to the north. Temps for September were 0.6° below normal and rainfall was 1.19" above normal. Lowest pressure from Isabel was 29.40". " - [ - + ] 

Roanoke - NWS Blacksburg reports that the Roanoke airport monthly mean temp was 1.0° below normal. Rainfall was 0.84" above normal. The average wind speed was 5.4 mph. The average sea-level pressure was 30.07"." [ - + ] 

Woodstock - " Wet (5th/18th) and cool (5-6 of 18). We seem to get the remnants of a tropical disturbance about every three years. Isabel produced somewhat less rain than most, but the winds on 19th and 20th did a fair amount of damage, and our power was out for a couple of days, which is unusual for us. Normal precipitation in the last quarter of the year will probably give us the second wettest in 18 years. The average precip for 1960-2002 is about 3/4" more than shown in the Virginia Weather Atlas as average for 1950-70. " - notes from Lauck [ +/- +/- ] 

North Carolina:

Asheville - from NWS GSP: The monthly mean temp was 0.5° below normal and the rainfall was 0.71" below normal. The average wind speed was 3.9 mph. [ - - ] 

Charlotte - NWS GSP reports the mean temp here was 1.7° below normal and precip was 6.63" above normal. The average wind speed was 3.9 mph. - [ - + ] 

Elizabeth City - The Elizabeth City Coast Guard Station [ECG] reported an average wind speed of 10.6 mph. The mean temp was 0.1° above normal while rainfall was 2.51" above normal. The average relative humidity was 80%. - from NWS AKQ [ + + ] 

Fayetteville - NWS RDU reports the average wind speed was 7.5 mph. The average relative humidity was 73%.

Cape Hatteras - " The average temperature in September 2003 was 75.1°. This was -0.4° cooler than the 1895-2003 average, the 44th coolest September on record (1895-2003). 3.94" of precipitation fell in September. This was -1.42" less than the 1895-2003 average, the 48th driest such month on record (1895-2003)." - from NCDC [ - - ] 

Greensboro - NWS RDU notes a mean temp here that was 1.0° below normal. Rainfall was 3.60" above normal. The average wind speed was 4.6 mph. The monthly sky cover average was 50%. NEW DAILY PRECIPITATION RECORDS ON THE 18TH AND 23. ON THE 18TH 2.28" FELL SURPASSING THE OLD RECORD 0.99" IN 1971. ON THE 23RD THE OLD RECORD WAS 1.38 IN 1946. NEW TOTAL WAS 1.71". - [ - + ] 

Hickory - The average wind speed was 3.3 mph. The average monthly temperature was 1.7° below normal while rainfall was 1.83" below normal - from NWS GSP [ - - ] 

Lumberton - The average wind speed was 6.6 mph. The average monthly temperature was 0.1° above normal while rainfall was 1.70" above normal - from NWS ILM [ + + ] 

Raleigh - NWS RDU reports the average daily temperatures were 1.3° below normal while precipitation was 0.21" above normal. The average wind speed was 6.0 mph. The average sky cover was 50%. NEW DAILY PRECIPITATION RECORD of 0.93" ON THE 23RD. OLD RECORD WAS 0.77" SET IN 1975." - [ - + ] 

Raleigh - Bob sends these notes: " Hurricane Isabel was the story for September. A number of trees were lost in Raleigh, but nothing in comparison to Hurricane Fran in September 1996. Raleigh was on the southern side (weaker side) of the circulation; therefore winds and rainfall was coming off the land versus a fetch off the Atlantic. Minimum pressure recorded was 28.93" and a peak wind gust of 39 mph. Even with Hurricane Isabel, rainfall for September was actually below normal. No severe weather was observed at this station during September except with the passage of Hurricane Isabel. " - [ M - ] 

Roxboro - Merriell reports: " Although September temperatures varied from warm to chilly, the averages were near normal. Rainfall was almost 3" above normal. A wind gust of 63 mph occurred on the 18th. Both above normal rainfall and peak wind gust resulted from Hurricane Isabel. " - [ + + ] 

Wilmington - From NWS ILM: The average temp was 2.2° below normal while rainfall was a 1.04" below normal. The average wind speed was 7.8 mph. - [ + - ] 

South Carolina:

Anderson - NWS GSP reports the monthly mean temp was 0.6° below normal. Rainfall was 2.48" below normal. The average wind speed was 5.1 mph. - [ - - ] 

Charleston - NWS CHS reports the monthly mean temp was 1.5° below normal. Rainfall was 1.52" below normal. The average wind speed was 7.7 mph. - [ - - ] 

Columbia - NWS CAE reports that the mean temp here was 1.8° below normal. Rainfall was a 0.34" above normal. The average wind speed was 4.4 mph. - [ + + ] 

Florence - The mean temp here was 1.6° below normal while rainfall totals were 2.82" below normal. The average wind speed was 6.4 mph. - from NWS ILM [ + - ] 

Greenville-Spartanburg - The monthly mean temperature was 0.7° below normal while rainfall was 2.25" below normal. The average wind speed was 4.7 mph. - from NWS GSP [ - - ] 

North Myrtle Beach - The mean temp was 1.0° above normal while rainfall was 3.21" below normal. The average wind speed was 6.2 mph. A record low temperature was set on the 30th with 48° surpassing the previous record of 51° set in 1951. " - NWS ILM [ + - ] 

Orangeburg - NWS CAE reports the average wind speed here was 5.2 mph.

Nearby Cities:

Tri-Cities - Total rainfall in September was well above normal across the area. While the number of rainy days were limited, significant rain fell on several of these days. Tri-Cities has almost broken the record for rainfall in a single year, and there are still three months left in the year. So far this year (January 1 to September 30), Tri Cities has received 54.16" of rainfall, which has nearly broken the record annual rainfall total of 54.50 inches set in 1950. The old record should be exceeded in October. Tri-Cities received 5.29" of rain during September, which was 2.21" above normal. It was the 5th wettest September on record at Tri-Cities. Measurable rain occurred on only eight days, but over an inch fell on three of those days. The heaviest rain fell on the 22nd when 1.25" was recorded. The wettest September at Tri-Cities was back in 1972, when 7.09" fell. The average monthly temperature at Tri-Cities was 65.8°, which was 0.8° below normal. It tied with 1994 as the 13th coolest September on record at Tri-Cities. No daily records were broken. The coolest September at Tri-Cities was back in 1967, when the average temperature was 62.6°. - from NWS MRX [ - + ] 

COLUMN DENOTATIONS:

A  maximum mean temperature T total precipitation (inches)
T1 Departure from normal
B  minimum mean temperature U maximum calendar day precipitation (inches)
C  monthly mean temperature
C1 Departure from normal
U1 date of maximum calendar day precipitation
D  maximum temperature V date(s) of maximum daily precipitation
E  date(s) of maximum temperature V1 maximum 24-hour precip. & date(s)
F  minimum temperature W number of days with precip. >= .01"
G  date(s) of minimum temperature  X number of days with precip. >= 1.0"
H  days with maximum temperature >=90 Y year-to-date precipitation (inches)
I  days with maximum temperature <=32 Z maximum calendar day snowfall (inches)
J  days with minimum temperature <=32 1 date of maximum calendar day snowfall (inches)
K  days with minimum temperature <= 0 2 number of days with snowfall
L  peak wind gust (miles per hour)  3 number of days with snowfall >= 1.0"
M  direction of peak wind gust 4  total snowfall for month (inches)
N  date(s) of peak wind gust  5 total snowfall for 2003-2004 season (inches)
O  number of days with thunder  6 maximum barometric pressure (inches)
P  number of days with hail 6A date of maximum barometric pressure 
Q  number of days with glaze 7 minimum barometric pressure (inches)
R  number of days with ice pellets 7A date of minimum barometric pressure
R1 number of days with dense fog [1/4 mile and less visibility] (i) incomplete data
S  local observation time for temps/precipitation (M) Missing, if listed in data table
 ~ "about" E estimated
 +  additional indeterminate number of days NR not recorded


For ACON VA/NC/SC Recent Weather News, Search CNN
http://www.cnn.com/WEATHER
 

National Weather Service Web Sites & Current Email Addresses
Within or Nearby the ACON VA/NC/SC Area Can Be Found At:

     NWS Washington/Baltimore, VA/MD
     NWS Wakefield, VA
     NWS Blacksburg, VA
     NWS Raleigh, NC
     NWS Newport/Morehead City, NC
     NWS Wilmington, NC
     NWS Greenville-Spartanburg, SC
     NWS Columbia, SC
     NWS Charleston, SC
     NWS Morristown, TN

     National Weather Service Homepages

     $$$ National Climatic Data Center, Asheville, NC $$$

STATION / LOCATION (MILES & DIRECTION FROM MAIN POST OFFICE)/OBSERVER / YEAR RECORDS BEGAN / EMAIL ADDRESS:

AHB   Ashburn, VA  - Gary Oldham  7/01 281' AMSL  n6skk@arrl.net ROK   Roanoke, VA 6SW Wendell Prillaman  4/76 wlprillaman@cox.net
ANN    Annandale, VA 1 3/4 ENE - Lowell Koontz  8/31/79  wwkoontz@verizon.net AKQ    Wakefield, VA NWS Wakefield Municipal Airport 36-58-53N 077-00-04W 33M
DCA    Arlington, VA Washington, DC, Reagan Washington National Airport 38-50-54N 077-02-03W 18M WSH   Washington, VA  David Yowell runamok@runamok.com
BCB    Blacksburg, VA NWS Virginia Tech Airport 37-13N 080-25W WEE   Weems, VA 3WNW Francis J. Socey
BRI     Bridgewater, VA Clayton Towers Ctowers@rica.net WOO  Woodstock, VA 5NW Lauck Walton - 12/1/85 jwalton@shentel.net
CEN   Centreville, VA Paul Bassett 1985 m.psb@verizon.net RGL   Ruther Glen, VA 38°0'45" N 77°32'29" W Danny Jessee 2003 danny@dannyjessee.com
CHO   Charlottesville, VA  Charlottesville-Albemarle Airport ASOS  (Rappahannock County) 38-08-18N 078-27-21W 192M AVL    Asheville, NC  Asheville Regional Airport 35-25-55N 082-32-15W 670M
DAN  Danville, VA, Danville Regional Airport, 36-34-22N 079-20-10W 175M  BRE    Brevard, NC 1SE Bob Keehn 1/1/90 rkeehn@brinet.com
IAD   Dulles - Washington-Dulles International Airport  38-56-05N 077-26-51W 93M  CLT    Charlotte, NC NWS Charlotte/Douglas International Airpot 35-12-48N 080-56-55W 220M
FCH    Falls Church, VA Erica Page - 3/7/94 Windie1970@aol.com HKY  Hickory, NC 
HAM    Hampton, VA 5NE Dave Kessel 1989 davidckessel@cox.net ECG  Elizabeth City, NC,  Coast Guard Air Station 36-15-47N 076-10-58W 11M
CTR  Chesterfield, VA Albert Arnold 06/03 FAY  Fayetteville, NC Fayetteville Regional Airport, 34-59-22N 078-52-48W 55M
HER    Herndon, VA R.M. Beall P- 10/76   T-  1/91 beall47@earthlink.net GSO   Greensboro, NC NWS Piedmont Triad International Airport 36-05-51N 079-56-37W 275M
HRN   Herndon, VA 4SW Russ Topping -  1985 weatherman@cox.net LBT    Lumberton, NC  Lumberton Municipal Airport 34-36-26N 079-03-36W 37M
LXI     Lexington, VA  Scott M. Lancey, WREL Radio -  06/96 weather@wrel.com RAL    Raleigh, NC 7NNW  Bob Woodson -  6/1/93 kf4mmm@qsl.net
LKU     Louisa, VA 1N Joseph Bowers 1944 - NWS ID  44-5050-02jmbiii@earthlink.net RDU   Raleigh-Durham, NC Raleigh-Durham International Airport 35-52-14N 078-47-11W 130M
LOU     Louisa, VA 6S John Bullock (about 1970) INACTIVE 1/1/02 ROX    Roxboro, NC 2SE Merriell A. Jay 1/93
LYH     Lynchburg, VA NWS Lynchburg Regional Airport 37-19-15N 079-12-24W 295M ILM     Wilmington, NC NWS New Hanover International Airport 34-16-06N 077-54-22W 9M
NEW    Newmarket, VA 2W Joyce Winfree joywood@shentel.net CHS   Charleston, SC NWS Charleston Air Force Base 32-53-56N 080-02-26W 13M
NPN     Newport News, VA 7N Gary Leonard -  6/91 GaryMLeonard@aol.com CAE    Columbia, SC NWS Columbia Metropolitan Airport 33-56-31N 081-07-05W 73M 
NOR     Norfolk, VA 3NE Jim Fentress 6/1/77 FLO    Florence, SC Florence Regional Airport 34-11-16N 079-43-51W 44M
ORF     Norfolk, VA 5NE 36-54-13N 076-11-31W 14M  1871 GSP   Greenville-Spartanburg, SC NWS Greenville-Spartanburg Airport 34-53-02N 082-13-15W 286M 
POR     Portsmouth, VA 36.81° North 76.33° West 3S Bill Trotter -  7/1/76 wxr@cox.net CRE    North Myrtle Beach, SC Grand Strand Airport 33-48-42N 078-43-26W 10M
MEC     Mechanicsville, VA Glen Martin 11/19/91 OGB   Orangeburg, SC  Orangeburg Municipal Airport 33-27-50N 080-51-13W 59M
FHC    Norfolk, VA  Fred Heutte Center 36° 54'N 76° 16'W 01/01/03 fhcgarden@cox.net AND   Anderson, SC 
RIC     Richmond, VA Richmond International Airport 37-30-40N 077-19-24W 50M TRI     Tri-cities, TN  (Bristol / Johnson / Kingsport), Tri-City Regional Airport 36-28-47N 082-23-56W 474M 
ROA    Roanoke, VA Roanoke Regional Airport 37-19-01N 079-58-27W 362M DAV  Davis, WV Dave Lesher wvweather@mountain.net