
| Portsmouth Weather Records
Service
Local Climatological Data
|
Station: PORTSMOUTH,
VIRGINIA
Month: JULY Year: 2000 Latitude: 36° 50'N Longitude: 76° 18'W (OFFICIAL CITY) Station Elevation: 20 FT Standard Time: EASTERN DAYLIGHT |
| Temperature | Degree Days | Precipitation | Wind
Sky Cover |
Weather | Peak Wind | ||||||||||
| Date | Max | Min | Mn | Dep | HDD | CDD | Total | Snow | Depth | Avg | Dir | Type | Types | Speed | Dir |
|
|
|
|
|
|
|
|
|
|
|
|
|
|
|
|
|
|
|
|
|
|
|
|
|
|
|
|
|
|
|
|
|
|
|
|
|
|
|
|
|
|
|
|
|
|
|
|
|
|
|
|
|
|
|
|
|
|
|
|
|
|
|
|
|
|
|
|
|
|
|
|
|
|
|
|
|
|
|
|
|
|
|
|
|
|
|
|
|
|
|
|
|
|
|
|
|
|
|
|
|
|
|
|
|
|
|
|
|
|
|
|
|
|
|
|
|
|
|
|
|
|
|
|
|
|
|
|
|
|
|
|
|
|
|
|
|
|
|
|
|
|
|
|
|
|
|
|
|
|
|
|
|
|
|
|
|
|
|
|
|
|
|
|
|
|
|
HOT HUMID |
|
|
|
|
|
|
|
|
|
|
|
|
|
|
|
|
|
|
|
|
|
|
|
|
|
|
|
|
|
|
|
|
|
|
|
|
|
|
|
|
|
|
|
|
|
|
|
|
|
|
|
|
|
|
|
|
|
|
|
|
|
|
|
|
|
|
|
|
|
|
|
|
|
|
|
|
|
|
|
|
|
|
|
|
|
|
|
|
|
|
|
|
|
|
|
|
|
|
|
|
|
DST LTG |
|
|
|
|
|
|
|
|
|
|
|
|
|
|
|
|
|
|
|
|
|
|
|
|
|
|
|
|
|
|
|
|
|
|
|
|
|
|
|
|
|
|
|
|
|
|
|
|
|
|
TSRA SHRA |
|
|
|
|
|
|
|
|
|
|
|
|
|
|
|
|
FROPA DZ |
|
|
|
|
|
|
|
|
|
|
|
|
|
|
|
|
|
|
|
|
|
|
|
|
|
|
|
|
|
|
|
|
|
SHRA TSRA |
|
|
|
|
|
|
|
|
|
|
|
|
|
|
|
|
|
|
|
|
|
|
|
|
|
|
|
|
|
|
|
|
|
DST LTG FROPA |
|
|
|
|
|
|
|
|
|
|
|
|
|
|
|
|
|
|
|
|
|
|
|
|
|
|
|
|
|
|
|
|
|
|
|
|
|
|
|
|
|
|
|
|
|
|
|
|
|
|
|
|
|
|
|
|
|
|
|
|
|
|
|
|
|
|
|
|
|
|
|
|
|
|
|
|
|
|
|
|
|
|
|
|
DST LTG |
|
|
|
|
|
|
|
|
|
|
|
|
|
|
|
|
|
|
|
|
|
|
|
|
|
|
|
|
|
|
|
|
|
|
|
|
| Temperature Data
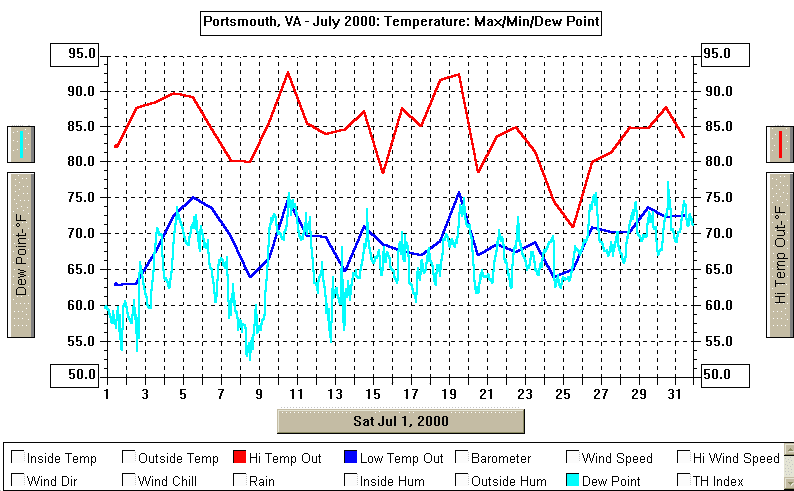
AVERAGE HIGH : 84.5º DEPARTURE: -4.4º AVERAGE LOW : 69.2º DEPARTURE: -2.1º MEAN: 76.9º DEPARTURE: -3.2º HIGHEST: 93º on 10th
Number of Days:
Heating Degree Days
Cooling Degree Days
NUMBER OF: 03 - Days Cloudy
15 - Days with Fog/Ground Fog
00 - Days with Frost 06 - Days with Thunderstorms
00 - Days with some type of Snowfall |
Precipitation Data
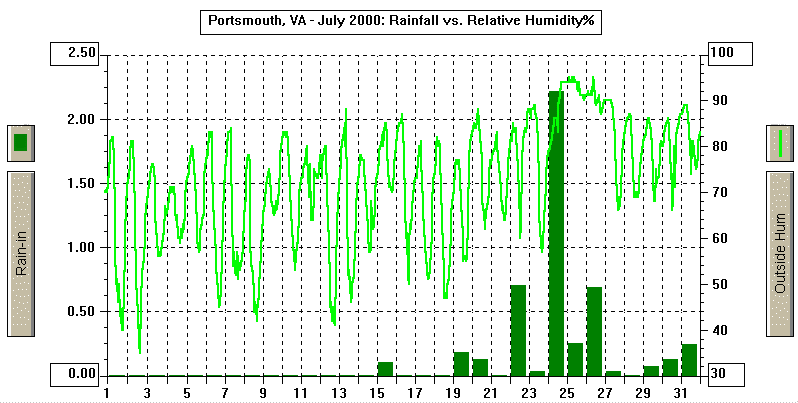
TOTAL FOR THE MONTH: 4.85" DEPARTURE FROM NORMAL: -0.47" or 91% GREATEST DAILY: 2.21" on the 24th GREATEST IN 24- HR PERIOD: 2.23" on the 24-25th AVERAGE DAILY: 0.16" NORMAL DAILY: 0.17" # DAYS WITH MEASURABLE PRECIPITATION: 13 YEAR-TO-DATE: 28.11" DEPARTURE: -0.06" or 99% of the norm MAXIMUM FOR JULY: 13.32" in 1999 --> (since
Snowfall, Ice Pellets
JULY MAX = 0.0" Number of Days:
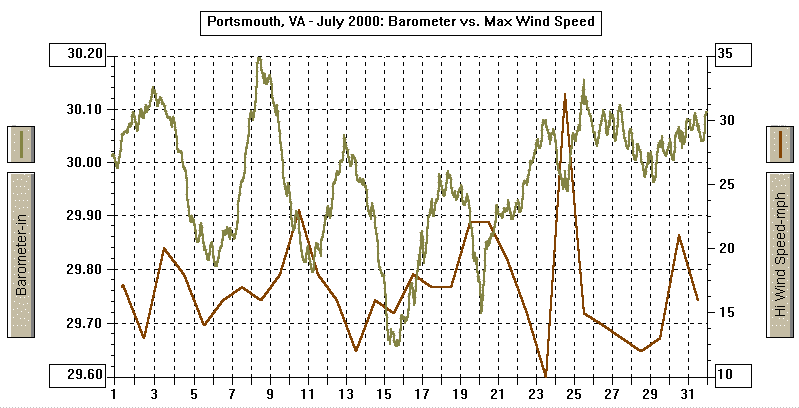
Pressure Data
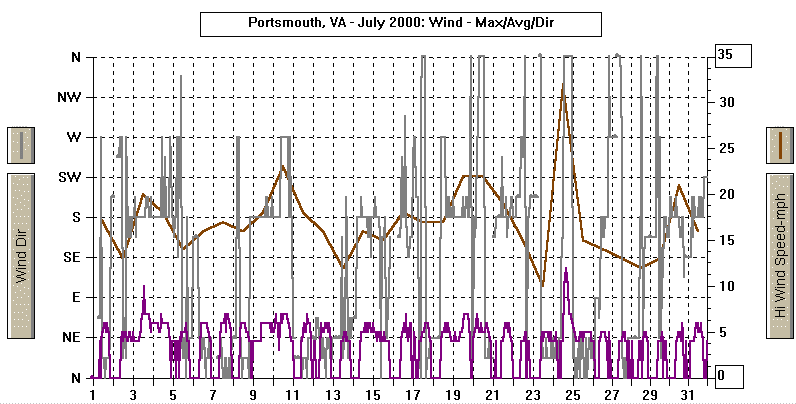
Wind
|
|
|
YEAR-TO-DATE 2000 [through 7/31/00; next update 8/31/00]
| Temperature Data
AVERAGE HIGH : 69.2º DEPARTURE: +0.5º AVERAGE LOW : 51.4º DEPARTURE: +1.6º MEAN: 60.3º DEPARTURE: +1.0º HIGHEST: 95º on 13th of May
Number of Days:
Heating Degree Days
Cooling Degree Days
NUMBER OF: 032 - Days Cloudy
81 - Days with Fog/Ground Fog
07 - Days with Frost 22 - Days with Thunderstorms
09 - Days with some type of Snowfall |
Precipitation Data
TOTAL: 28.11" DEPARTURE FROM NORMAL: -0.07" or 99% GREATEST DAILY: 2.21" on July 24th GREATEST IN 24- HR PERIOD: 2.23" on the 24-25th of July AVERAGE DAILY: 0.13" NORMAL DAILY: 0.13" # DAYS WITH MEASURABLE PRECIPITATION: 76 or 35.68% MAXIMUM: 5.60" in May
Snowfall, Ice Pellets
Number of Days: WITH 0.01" OR MORE PRECIP: 76
Pressure Data
|
| PWRS DENOTATIONS: SU/CL = Clear sky; PC = Partly cloudy sky; C = cloudy sky; NA, not available; NR, not recorded; TEMP, temperature; MAX, maximum; MIN, minimum; T, trace of precipitation; INOP, inoper- ative equipment; MPH, miles per hour; DN, departure from normal; DEP, departure; YR, year; NORM, normal; DST LTG, distant lightning; FROP or FROPA, frontal passage; AM morning; AFT afternoon hours; EVE evening hours; PM evening hours; E estimated; VBL, variable wind directions; TS, tropical storm; |
METAR DENOTATIONS
|
BC Patches BL Blowing BR Fog with visibilites > 5/8 but <=6 statute miles and below to 5/8 mile DU Dust (widespread) DS Duststorm DZ Drizzle FC Funnel Cloud FC+ Tornado/waterspout FG Fog with visibility <= 5/8 statute miles FU Smoke FZDZ Freezing drizzle FZRA Freezing rain FZFG Freezing fog GR Hail GS Small hail HZ Haze IC Ice crystals PL Ice pellets PY Spray RA Rain SA Sand SS Sandstorm PO Sand or dust whirls SG Snow granules |
SH Shower
SHRA Shower of rain SHSN Shower of snow SHPE Shower of ice pellets SHGR Shower with hail SHGS Shower with small hail SM Statute miles SN Snow SQ Squalls TS Thunderstorm TSGR Thunderstorm with hail TSGS Thunderstorm with small hail TSPE Thunderstorm with ice pellets TSRA Thunderstorm with rain TSSN Thunderstorm with snow UP Unknown precipitation VA Volcanic ash VC Vicinity V V Used for obscurred sky METAR Qualifiers: (now placed in FRONT of code) - Light +
Heavy DR Low drifting
M Below ( -x.x degrees)
|